
Identify a dependent variable in the experiment represented
in Figure 3 A. Identify the control group for the
experiment represented in Figure 4. Based on the data in Figure 4, describe the effect of elevated FGF5 on the
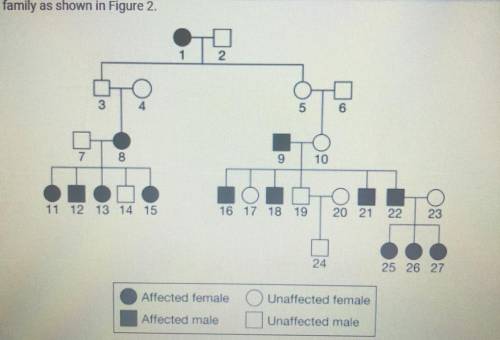
rate of hair growth in culture. Based on Figure 2, if individuals 19 and 20 have another child, calculate the
probability that the child will be affected with FT, assuming that individual 20 has no family history of FT.

Answers: 2


Other questions on the subject: Biology
Biology, 22.06.2019 01:00, gatornathan79
Why reason best illustrates why hershey and chase chose to use viruses in their experiment?
Answers: 2
Biology, 22.06.2019 06:00, briana21092005
Where substance is produced during cellular respiration
Answers: 1
Biology, 22.06.2019 17:00, alainacorkell5364
Your sense of touch depends upon: a. direct contact b. heat chemical c. reactions d. pain
Answers: 2
You know the right answer?
Identify a dependent variable in the experiment represented
in Figure 3 A. Identify the control gro...
Questions in other subjects:

Mathematics, 28.02.2021 22:40


Advanced Placement (AP), 28.02.2021 22:40
Mathematics, 28.02.2021 22:40

Social Studies, 28.02.2021 22:40

History, 28.02.2021 22:50


