20 points help asap
Part B
Take a look at this real data collected by a seismograph on May 27...

Biology, 13.05.2021 21:30 sierravick123owr441
20 points help asap
Part B
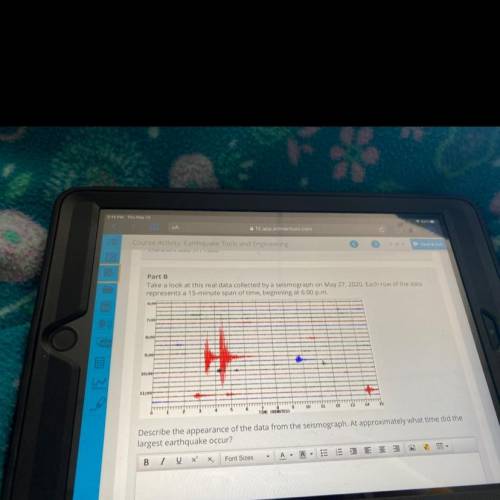
Take a look at this real data collected by a seismograph on May 27, 2020. Each row of the data
represents a 15-minute span of time, beginning at 6:00 p. m.
6:00
7:00
8:00
9:00-
10:00
11:00
11
12
TIME (MINUTES)
Describe the appearance of the data from the seismograph. At approximately what time did the
largest earthquake occur?

Answers: 3


Other questions on the subject: Biology
Biology, 21.06.2019 17:00, tdyson3p6xvtu
Are produced in the light reactions and used in the calvin cycle. a)nadh and atp b)electrons and sugar c)nadt+ and adp d)sugar molecules
Answers: 1
Biology, 22.06.2019 12:10, lydiapoetz5330
Which is the most likely reason the writer of the play pygmalion chose to change the character of galatea from a statue to working-class woman?
Answers: 1
You know the right answer?
Questions in other subjects:


Business, 02.11.2020 17:00


History, 02.11.2020 17:00
Mathematics, 02.11.2020 17:00
Mathematics, 02.11.2020 17:00

Chemistry, 02.11.2020 17:00


