
Biology, 03.05.2021 17:20 tstaples02
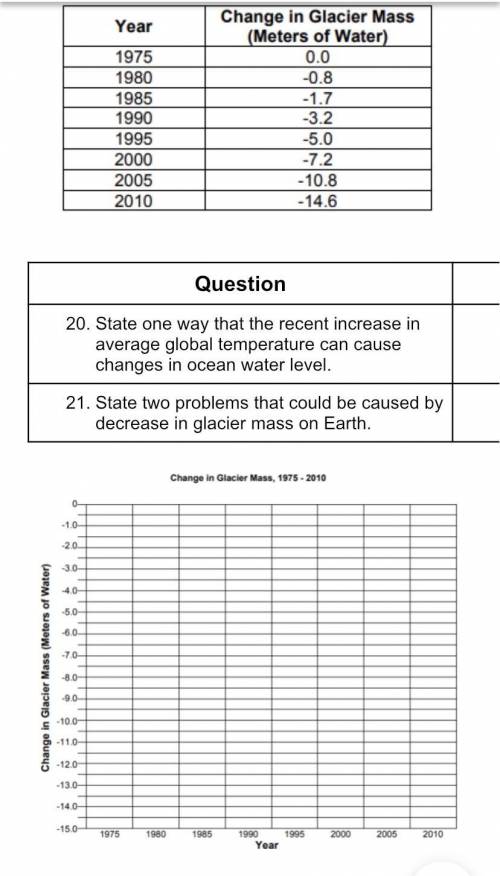
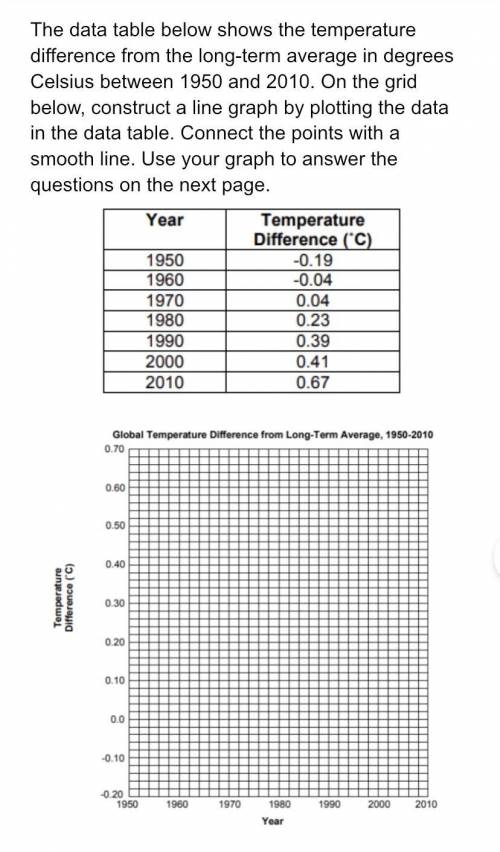
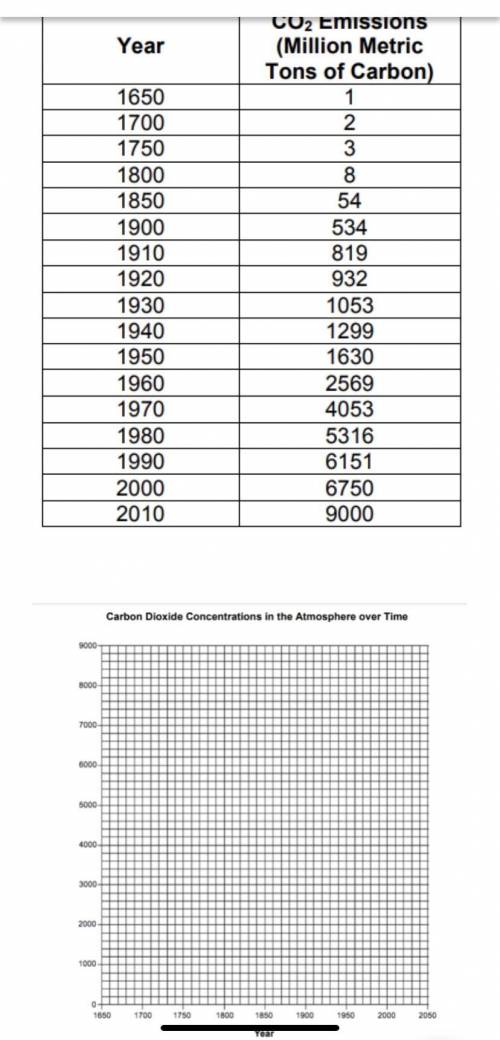
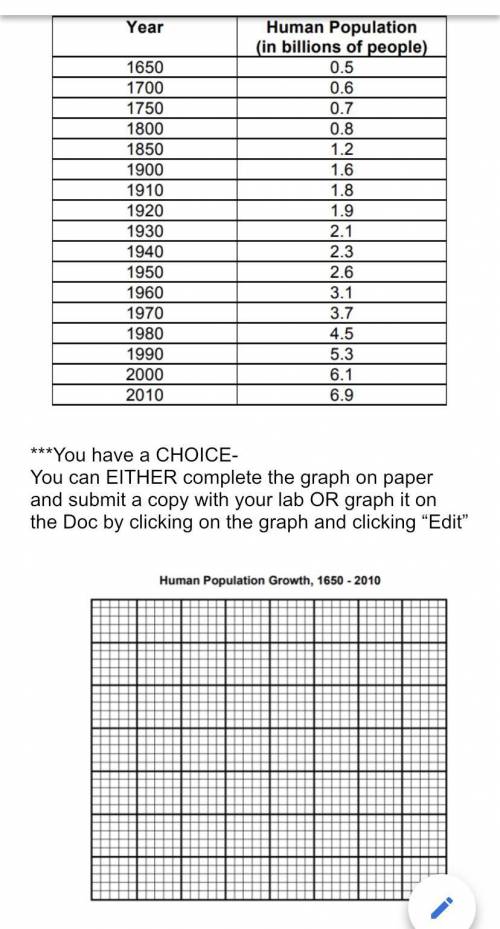
Graphing human population growth, the green house effect & global warming. If someone can please help with making a graph for both these situations that would be helpful. I’ve attached images.

Answers: 1


Other questions on the subject: Biology
Biology, 22.06.2019 04:30, emilysambrano2
This part insulates the reaction chamber from the transfer of heat to or from the surrounding environment
Answers: 1
Biology, 22.06.2019 17:50, hrijaymadathil
Babies with very low or very high birth weight are less likely to survive. observe a graph of the data. % babies born at different weights % babies born in that category 6.0 6.5 in 50-555 70-75 80-8511 100-1055 which statement is a valid claim that could be made using the data in the graph? directional selection is occurring because the graph favors an extreme. mark this and retum save and exit next submit o type here to search
Answers: 2
You know the right answer?
Graphing human population growth, the green house effect & global warming. If someone can please...
Questions in other subjects:

Mathematics, 08.07.2019 20:30
Mathematics, 08.07.2019 20:30

Computers and Technology, 08.07.2019 20:30
Biology, 08.07.2019 20:30


