
This chart shows the average amounts of precipitation, high and low temperature for each month of the year for Houston, Texas. What does this chart best represent and why?
A) This chart shows weather for each month of the year.
B) This chart shows climate for each month of the year based on averages.
C) This chart shows climate because it gives data for each day.
D)This chart shows weather and how it changes every day.
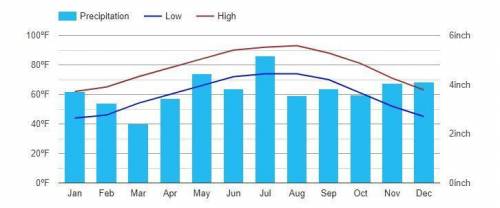

Answers: 3


Other questions on the subject: Biology
Biology, 21.06.2019 19:00, dmaxbexkham
Granite rock is light in color. which feature directly contributes to this color? the process that forms granite the amount of silica minerals in granite the shape of the grains found in granite the unique pattern formed by grains in granite
Answers: 1
You know the right answer?
This chart shows the average amounts of precipitation, high and low temperature for each month of th...
Questions in other subjects:

History, 23.08.2019 08:00

English, 23.08.2019 08:00


Chemistry, 23.08.2019 08:00

Mathematics, 23.08.2019 08:00
Mathematics, 23.08.2019 08:00
Biology, 23.08.2019 08:00


