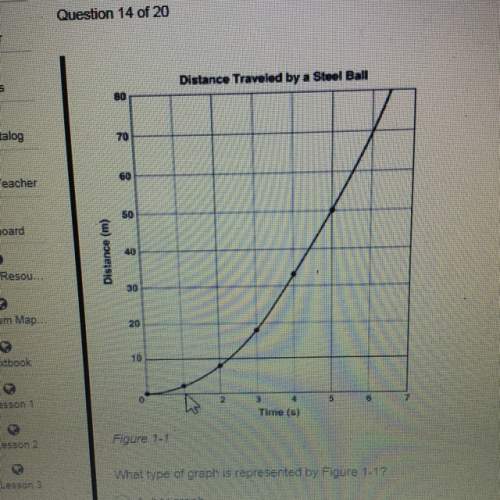
What type of graph is represented by figure 1-1?
a) bar
b)line
c)circle
d)...

Biology, 03.11.2019 05:31 janyiareese12
What type of graph is represented by figure 1-1?
a) bar
b)line
c)circle
d)none of the above

Answers: 3


Other questions on the subject: Biology
Biology, 22.06.2019 03:50, ashleybarrera2000
Connection compare and contrast genetic engineering to the process of natural selection. select all statements that are true.
Answers: 1
Biology, 22.06.2019 10:00, milesjreece3939
The image shows the evolution of a species of fish. a few fish from a population developed different social behaviors and evolved into different species. two fish according to the image, the fish underwent . the new species of fish had mating seasons that were different from that of the original fish. because of the differences in mating seasons, the fish underwent reproductive isolation. this mode of isolation would be .
Answers: 1
Biology, 22.06.2019 14:30, reinajoy
Which of these is not an example of molecular homology? 1. use of dna and rna as genetic material 2.use of glycolysis as the first step in cellular respiration in both plants and animals 3. the lack of an igf-1 gene in prokaryotes 4. the use of aldolase b to break down fructose in bacteria, plants and animals
Answers: 3
Biology, 22.06.2019 16:30, devoncruz23
Why do mountaineers become breathless as they reach high altitudes
Answers: 1
You know the right answer?
Questions in other subjects:


Mathematics, 23.04.2020 00:49


