"which inference can be made from the graphs?
(1)the increase in sewage waste from 1950 to 19...

"which inference can be made from the graphs?
(1)the increase in sewage waste from 1950 to 1970 was due to a decreasing human population.
(2)the decrease in sewage waste shows that the environmental problems associated with land pollution have been solved.
(3)sewage waste is a good source of nutrients for most fish.
(4)increases in sewage waste were responsible for decreasing oxygen levels in the lake."
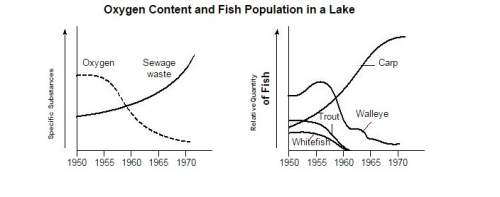

Answers: 1


Other questions on the subject: Biology
Biology, 22.06.2019 16:30, janiyagoldsmith
What are the three different shapes, or structures, of carbon-based molecules
Answers: 2
Biology, 22.06.2019 21:00, primmprincess312
1)some people believe that certain drugs such as marijuana should be legalized. do you agree or disagree? 2)what impact might legalization have on forensic science as a field? which drug presents the greatest challenges to forensic science? why?
Answers: 1
Biology, 22.06.2019 21:40, murtaghliam1
In which area of the neuron is an action potential initially generated?
Answers: 1
You know the right answer?
Questions in other subjects:


Mathematics, 14.01.2021 01:10

English, 14.01.2021 01:10
Chemistry, 14.01.2021 01:10


