B)
Gopal then measured the mass of the seed leaves as the seeds germinate.
The graph below sho...

Biology, 10.04.2021 14:00 thomasalmo2014
B)
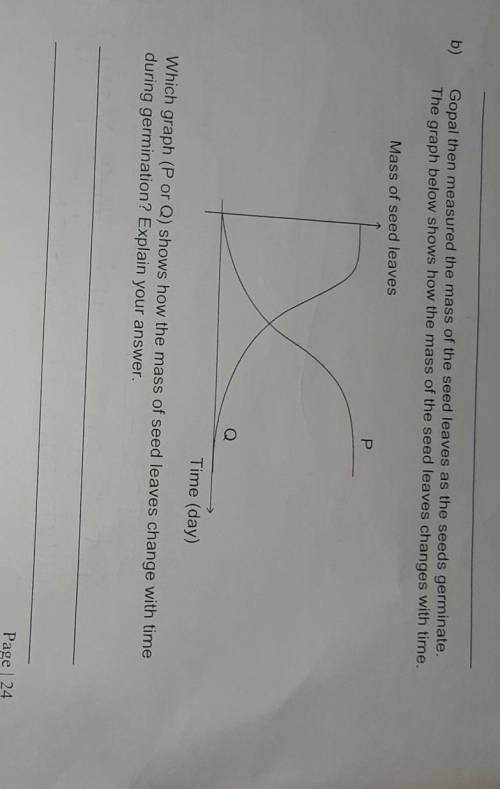
Gopal then measured the mass of the seed leaves as the seeds germinate.
The graph below shows how the mass of the seed leaves changes with time.
Mass of seed leaves
P
Time (day)
Which graph (P or Q) shows how the mass of seed leaves change with time
during germination? Explain your answer.

Answers: 1


Other questions on the subject: Biology
Biology, 22.06.2019 00:50, bvghchg8812
Select the situation bellow that would produce a total displacement of zero. a. a trip to the moon and then to mars b. a horse galloping from one end of a field to another c. the criss-crossing path of a bug as it flies from flower to flower d. a round-trip ride to school and back
Answers: 2
Biology, 22.06.2019 08:00, bsmith892341
What advantages does a pedigree have over a written passage?
Answers: 3
You know the right answer?
Questions in other subjects:

Health, 23.08.2019 01:30

Mathematics, 23.08.2019 01:30

English, 23.08.2019 01:30

English, 23.08.2019 01:30
Health, 23.08.2019 01:30
Biology, 23.08.2019 01:30
History, 23.08.2019 01:30


