
Biology, 09.04.2021 05:30 kyrabrown33
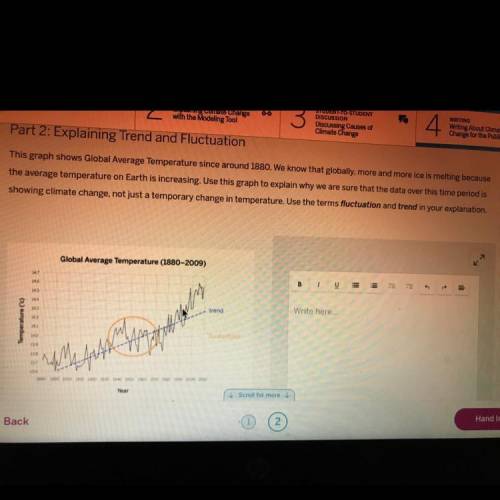
This graph shows Global Average Temperature since around 1880. We know that globally, more and more ice is melting because
the average temperature on Earth is increasing. Use this graph to explain why we are sure that the data over this time period is
showing climate change, not just a temporary change in temperature. Use the terms fluctuation and trend in your explanation.
Global Average Temperature (1880-2009)

Answers: 2


Other questions on the subject: Biology
Biology, 21.06.2019 16:00, elopezhilario4389
Arrange these elements of the intrinsic conduction system in the order that a depolarizing impulse travels during a normal heartbeat. rank from first to last. do not overlap any tiles. view available hint(s) reset av nodeav bundleinternodal pathwaysbundle branchessa nodepurkinje fibers
Answers: 2
Biology, 21.06.2019 18:40, sdwhitneyhillis
During sunny hours, a large amount of build up between the hours of 1: 00-5: 00 pm. a. ozone b. mercury c. lead d. sulfuric acid
Answers: 1
You know the right answer?
This graph shows Global Average Temperature since around 1880. We know that globally, more and more...
Questions in other subjects:


Social Studies, 03.03.2020 19:25


