
Biology, 31.03.2021 16:10 Morganwing1019
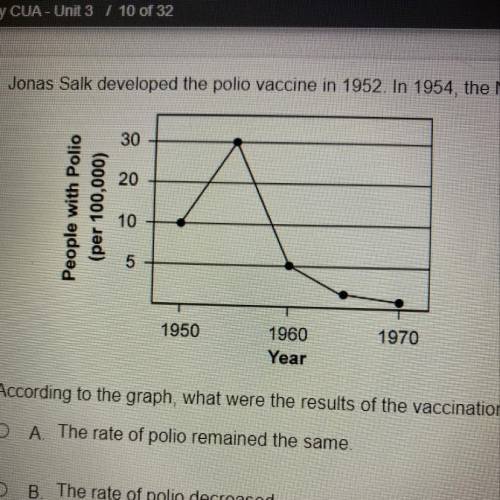
According to the graph, what were the results of the vaccination between 1954 and 1960?
A. The rate of polio remained the same.
B. The rate of polio decreased
C. The rate of polio decreased, then increased.
o
D. The rate of polio increased

Answers: 2


Other questions on the subject: Biology
Biology, 22.06.2019 01:30, timothyashburn8
Twin boys have girlfriends one of the couples have a baby would the dna of the lil baby be the same as the couples dna bc the boys are identical twins
Answers: 1
Biology, 22.06.2019 11:30, itssergioa
According to theories of how life began, how did early organic molecules begin to separate from the outside world? a: specialized enzymes were required b: chains of amino acids created a barrier c: formation of microspheres or vesicles d: rna catalyzed the formation of membranes
Answers: 2
Biology, 22.06.2019 14:00, treavonknorton
Vinegar has a ph of 3, and household ammonia has a ph of 11. is the concentration of h+ greatest in the vinegar or ammonia?
Answers: 1
Biology, 22.06.2019 14:50, mihirkantighosh
An organism's reproductive strategy includes all of the following except a. the number of offspring produced. b. the amount of energy expended in producing offspring. c. the length of time parental care is given d. the number of alleles an organism passes on.
Answers: 3
You know the right answer?
According to the graph, what were the results of the vaccination between 1954 and 1960?
A. The rate...
Questions in other subjects:

Mathematics, 13.11.2020 08:50

History, 13.11.2020 08:50
Mathematics, 13.11.2020 08:50
Mathematics, 13.11.2020 08:50


