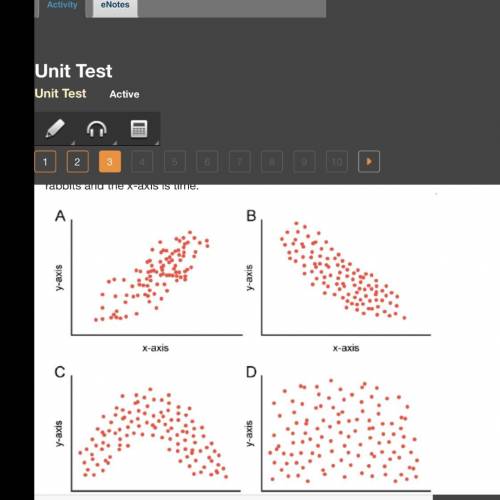
The scatterplots indicate the population of rabbits in the population over time. The y-axis represents the number of rabbits and the x-axis is time.
Which graph most likely represents a rabbit population that found a new, larger habitat, but then eventually experienced an increase in predation?
Graph A
Graph B
Graph C
Graph D


Answers: 1


Other questions on the subject: Biology

Biology, 21.06.2019 19:00, geometryishard13
Imagine that a mouse has white fur because of a mutation in its dna. which of the following conclusions can be drawn
Answers: 1

Biology, 22.06.2019 12:40, sheilashair
Which statement describes how favorable traits in a population relate to natural selection? they are the only traits that ever exist in the population. they build in the population over time. they are rarely passed on to offspring. they are found only in a few individuals within the population.
Answers: 1

Biology, 22.06.2019 20:50, sillyvanna
Assume that you are interested in separating short (200-400 bp) dna molecules from a pool of longer molecules in the 10,000-20,000 nucleotide range. you have two recipes for making your polyacrylamide gels: one recipe uses 1.5 percent agarose and would be considered a “hard gel,” while the other uses 0.5 percent agarose and would be considered a loose gel. which gel should you use to separate the short (200-400 bp) dna molecules from a pool of longer molecules in the 10,000-20,000 nucleotide range?
Answers: 3
You know the right answer?
The scatterplots indicate the population of rabbits in the population over time. The y-axis represen...
Questions in other subjects:

Biology, 06.10.2019 06:00


Mathematics, 06.10.2019 06:00

Mathematics, 06.10.2019 06:00


Chemistry, 06.10.2019 06:00

Chemistry, 06.10.2019 06:00

Biology, 06.10.2019 06:00

History, 06.10.2019 06:00


