
Biology, 24.03.2021 01:00 orcawave9408
Created by e2020
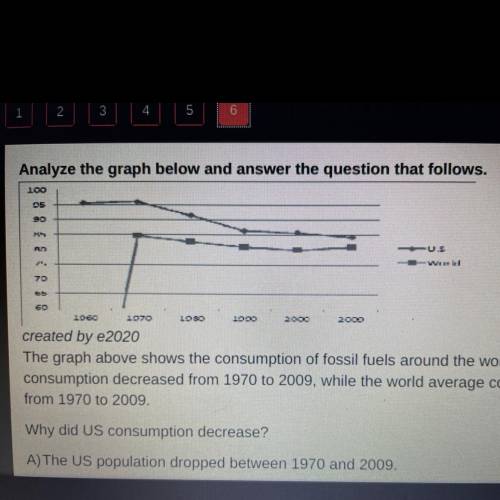
The graph above shows the consumption of fossil fuels around the world and in the US since 1960. US
consumption decreased from 1970 to 2009, while the world average consumption remained approximately even
from 1970 to 2009.
Why did US consumption decrease?
A) The US population dropped between 1970 and 2009.
B) The US population became aware of the fossil-fuel dependency and have reduced their
consumption.
C)The US is running out of fossil fuels, and fossil fuels are too expensive to purchase from
foreign sources.
D)none of the above

Answers: 1


Other questions on the subject: Biology
Biology, 22.06.2019 06:30, hellothere2458
What are examples of the plant life and animal life that can be found in each type of terrarium
Answers: 1
You know the right answer?
Created by e2020
The graph above shows the consumption of fossil fuels around the world and in the...
Questions in other subjects:

Mathematics, 21.05.2021 03:50


Mathematics, 21.05.2021 03:50


