
Biology, 21.03.2021 22:30 angelasan16
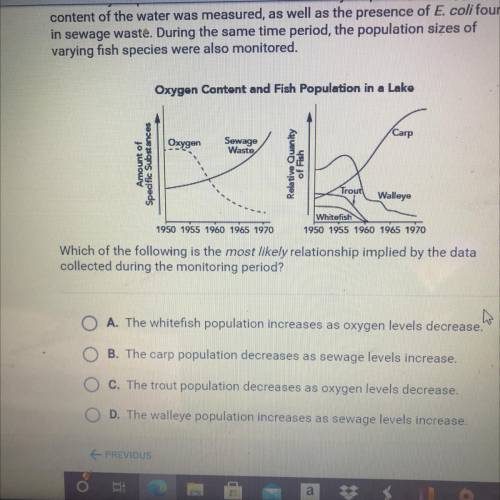
The two graphs shown below represent data collected from the same lake
over a 20-year period. Over the course of the 20-year period, the oxygen
content of the water was measured, as well as the presence of E. coli found
in sewage waste. During the same time period, the population sizes of
varying fish species were also monitored.
Oxygen Content and Fish Population in a Lako
Carp
Oxygen
Sewage
Waste
Amount of
Specific Substances
Relative ananny
Trout
Walleye
1950 1955 1960 1965 1970
Whitefish
1950 1955 1960 1965 1970
Which of the following is the most likely relationship implied by the data
collected during the monitoring period?
O A. The whitefish population increases as oxygen levels decrease.
B. The carp population decreases as sewage levels increase.
O c. The trout population decreases as oxygen levels decrease.

Answers: 1


Other questions on the subject: Biology
Biology, 22.06.2019 02:20, jimperez9616
Astudent analyzed ears of corn that demonstrated two traits in the f2 kernels, purple or white colors and smooth on wrinkled shapes. a tabulation of 135 individual kernels gave the following results: purple and smooth = 75 white and smooth = 28 purple and wrinkled = 24 white and wrinkled = 8 what would be the only phenotype present in the f1 ger
Answers: 3
Biology, 22.06.2019 02:50, alisonn2004
What is the term for the two sets of chromatids formed in the parent cell a. haploid b. diploid c. gamete d. tetrad
Answers: 1
Biology, 22.06.2019 07:30, ayanajames0928
What will happen if deforestation continue to destroy the green plant on the planet
Answers: 2
You know the right answer?
The two graphs shown below represent data collected from the same lake
over a 20-year period. Over...
Questions in other subjects:


Mathematics, 23.02.2020 08:07
Mathematics, 23.02.2020 08:07

Chemistry, 23.02.2020 08:08

Chemistry, 23.02.2020 08:09
Mathematics, 23.02.2020 08:09


