
Biology, 20.03.2021 02:10 kenziepickup
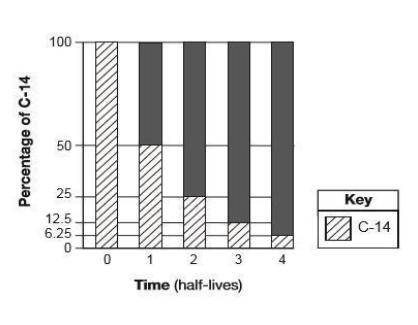
A bar graph of the radioactive decay of carbon-14 is shown below.
Carbon-14 decays to Nitrogen-14. The solid black sections of the bars on the graph represent the percentages of _.
(A) carbon-14 from the original sample that has not decayed
(B) uranium-238 from the original sample that has not decayed
(C) nitrogen-14 decay product resulting from the radioactive decay
(D) lead-206 decay product resulting from the radioactive decay

Answers: 2


Other questions on the subject: Biology
Biology, 21.06.2019 13:50, elliehemms6324
Athermometer is placed in water in order to measure the water’s temperature. what would cause the liquid in the thermometer to rise?
Answers: 2
Biology, 22.06.2019 03:00, shardaeheyward4980
Agenus is a taxonomic grouping that identifies a collection of species. when a scientist discovers a new species, how is this species assigned to a genus
Answers: 1
Biology, 22.06.2019 04:40, testedagent2823
The cluster of developing cells from conception until birth is called an
Answers: 1
You know the right answer?
A bar graph of the radioactive decay of carbon-14 is shown below.
Carbon-14 decays to Nitrogen-14...
Questions in other subjects:

French, 27.05.2021 20:00

English, 27.05.2021 20:00

Mathematics, 27.05.2021 20:00
Mathematics, 27.05.2021 20:00
Mathematics, 27.05.2021 20:00

Chemistry, 27.05.2021 20:00


