Biology, 18.03.2021 02:50 tyaniahawarren
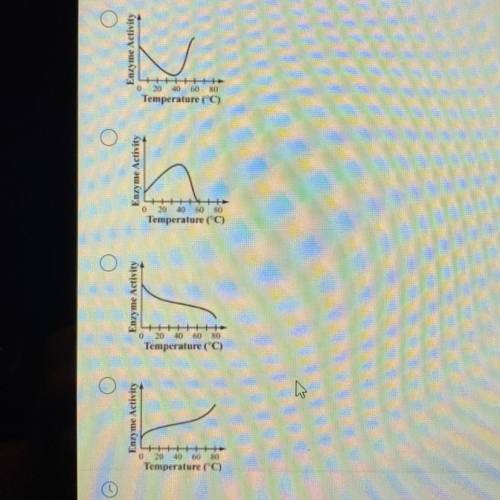
24. Human body temperature is approximately 37C. Which of the graphs below best shows how enzyme activity is affected by temperature in the human body?


Answers: 3


Other questions on the subject: Biology


Biology, 22.06.2019 00:30, savannnab1890
According to the cladogram, which organisms have roundworms as a common ancestor?
Answers: 1

Biology, 22.06.2019 06:30, alandrabell9234
The energy required to vaporize a certain amount of a substance is greater than the amount of energy necessary to raise the temperature of the same amout of that substance by 1 degreee celcius
Answers: 2

Biology, 22.06.2019 13:00, shanicet047ox9ff6
This rapid change in species that rarely leaves behind fossil evidence is referred to as
Answers: 3
You know the right answer?
24. Human body temperature is approximately 37C. Which of the graphs below best shows how enzyme act...
Questions in other subjects:


