
Biology, 18.03.2021 02:30 sanchezvianna55
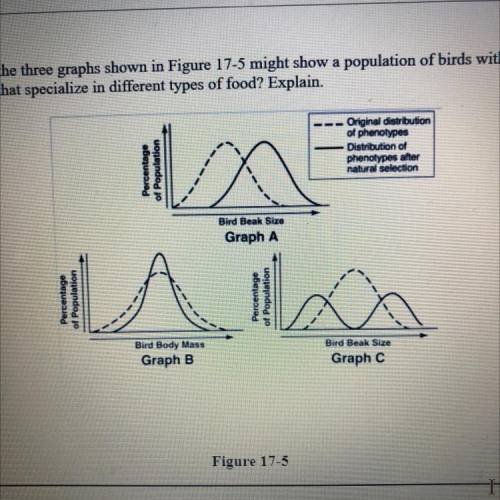
24. Which of the three graphs shown in Figure 17-5 might show a population of birds with
members that specialize in different types of food? Explain.
Percentage
of Population
Original distribution
of phenotypes
Distribution of
phenotypes after
natural selection
Bird Beak Size
Graph A
Percentage
of Population
Percentage
of Population
Bird Beak Size
Bird Body Mass
Graph B
Graph C

Answers: 1


Other questions on the subject: Biology
Biology, 22.06.2019 07:20, Dallas3506
Some tools have graduations to show multiple measurements. for example, a ruler may have graduations for both millimeters and centimeters. when measuring the length of an earthworm, which graduations would allow for the most accurate measurement? millimeters centimeters decimeters meters
Answers: 2
Biology, 22.06.2019 13:30, jeanine239
During the process of blank and molecules such as a glucose must use a protein channel to cross through a cell membrane
Answers: 1
Biology, 22.06.2019 15:10, dudedude29271
What tool do geneticists use to predict the outcome of genetic crosses? a. karyotype b. punnett square c. centrifuge
Answers: 2
You know the right answer?
24. Which of the three graphs shown in Figure 17-5 might show a population of birds with
members th...
Questions in other subjects:

Mathematics, 03.03.2021 01:20

Mathematics, 03.03.2021 01:20
Mathematics, 03.03.2021 01:20
English, 03.03.2021 01:20
Mathematics, 03.03.2021 01:20


