
Biology, 11.03.2021 22:20 ladybugperez05
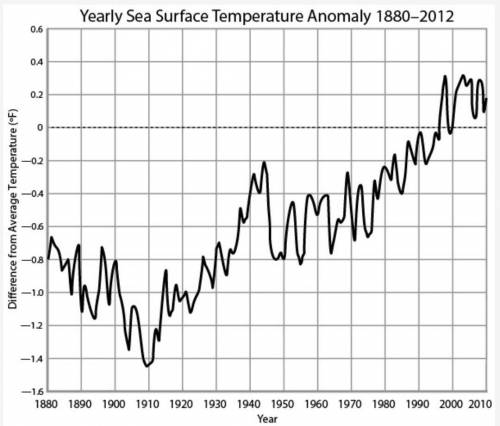
In order to understand the impact of climate change, a scientist collected measurements of average yearly sea surface temperatures from 1880 to 2012. His data is graphed below. How has average ocean temperature changed in the period from 1980 to 2010?
a graph depicting yearly sea surface temperature from 1880-2012. The X axis represents the years from 1880 to 2010 in increments of ten years. The Y axis represents the difference from average temperature in degrees Fahrenheit ranging from -1.6 to 0.6. 1880 shows a temperature difference of -0.8, 1890 shows a temperature difference of -1.1, 1900 shows a temperature difference of -1.05, 1910 shows a temperature difference of -1.5, 1920 shows a temperature difference of -1.15, 1930 shows a temperature difference of -0.9, 1940 shows a temperature difference of -0.55, 1950 shows a temperature difference of -0.8, 1960 shows a difference of -0.5, 1970 shows a difference of -0.7, 1980 shows a temperature difference of -0.3, 1990 shows a temperature difference of -0.2, 2000 shows a temperature difference of -0.19 and 2010 shows a temperature difference of 0.1.
© 2016 NOAA
Ocean temperatures have decreased on average.
Ocean temperatures have increased on average.
Ocean temperatures have become more varied on average.
Ocean temperatures have become less varied on average.

Answers: 2


Other questions on the subject: Biology
Biology, 21.06.2019 23:00, Jenniferlam12
What kind of crystalline solid is graphite? o a. molecular solid b. metallic solid o c. network solid d. ionic solid
Answers: 3
Biology, 22.06.2019 08:00, rosepotato789
Two students are working together on an experiment that measures the effect of different liquid fertilizers on the thickness of plants’ stems. which is most likely to result in the greatest amount of error in their scientific experiment? a. one student measures the plant stem widths by using calipers. the other student measures the widths of the same plant stems again by using a different pair of calipers. b. one student measures the plant stem widths by using calipers. the other student types the measurements as they are taken into a computer spreadsheet. c. one student weighs liquids for the experiment by using a calibrated scale. the other student weighs liquids for the experiment by using a different calibrated scale.
Answers: 1
Biology, 22.06.2019 09:00, avahrider1
Were you able to observe the nucleolus in any of the cells if so which ones
Answers: 3
You know the right answer?
In order to understand the impact of climate change, a scientist collected measurements of average y...
Questions in other subjects:

Mathematics, 12.04.2021 23:10


History, 12.04.2021 23:10

Arts, 12.04.2021 23:10


Arts, 12.04.2021 23:10


