Onginal population

Biology, 18.02.2021 18:40 vlactawhalm29
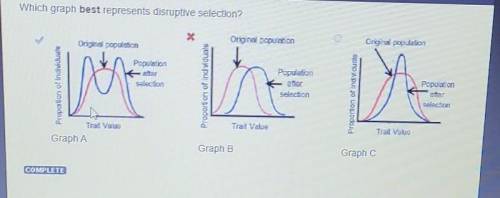
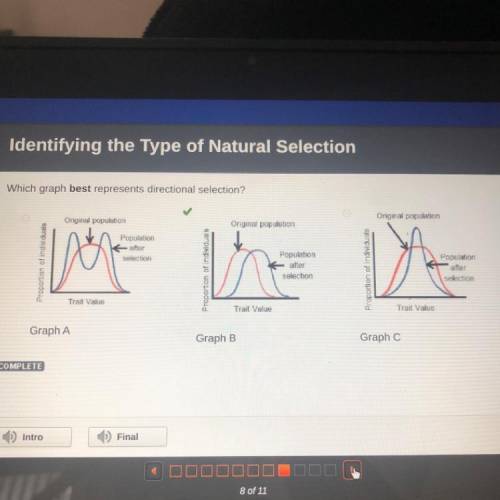
Which graph best represents directional selection?
Original population
Onginal population
Original population
Population
after
selection
Population
after
selection
Proportion of individuals
Population
after
selection
Trait Value
Trait Value
Trait Value
Graph A
Graph B
Graph C
COMPLETE

Answers: 2


Other questions on the subject: Biology
Biology, 22.06.2019 08:20, mommabear4887
Wich level of organization includes all the other levels or organizations
Answers: 1
Biology, 22.06.2019 10:50, crosales102
Which type of transport is responsible for oxygen entering into blood cells? a. vesicle b. passive c. facilitated d. active b. passive
Answers: 2
Biology, 22.06.2019 17:50, radcon8099
Babies with very low or very high birth weight are less likely to survive. observe a graph of the data. me % babies born at different weights - babies born in that category which statement is a valid claim that could be made using the data in the graph? directional selection is occurring because the graph favors an extreme. mark this and totum save and exit next submit type here to search
Answers: 2
Biology, 22.06.2019 19:30, destinywashere101
Which sets of mrna codons could genetically come for a protein with the following amino acid composition
Answers: 1
You know the right answer?
Which graph best represents directional selection?
Original population
Onginal population
Onginal population
Questions in other subjects:

Geography, 13.07.2020 20:01

Biology, 13.07.2020 20:01

English, 13.07.2020 20:01

Mathematics, 13.07.2020 20:01
Mathematics, 13.07.2020 20:01

Biology, 13.07.2020 20:01


