
Biology, 14.02.2021 06:00 bhaven2005
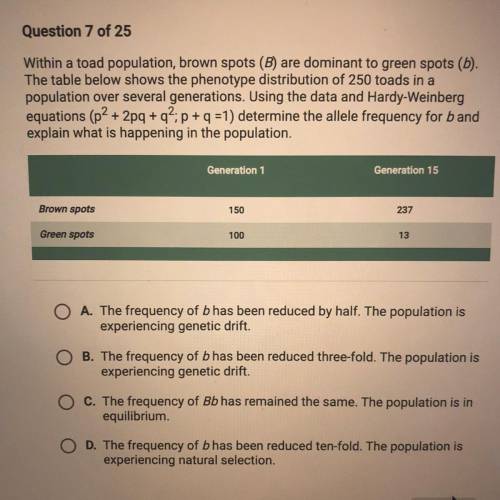
Within a toad population, brown spots (B) are dominant to green spots (b).
The table below shows the phenotype distribution of 250 toads in a
population over several generations. Using the data and Hardy-Weinberg
equations (p2 + 2pq +92; p + q =1) determine the allele frequency for band
explain what is happening in the population.

Answers: 2


Other questions on the subject: Biology
Biology, 21.06.2019 22:30, shawnball8571
Models are non-visual ways of coummincating how someone thinks about something in the natural world
Answers: 1
Biology, 22.06.2019 09:40, QueenMiah16
Explain how paleontologists use trilobite fossils as index fossils for various geologic time periods.
Answers: 1
You know the right answer?
Within a toad population, brown spots (B) are dominant to green spots (b).
The table below shows th...
Questions in other subjects:

Chemistry, 03.09.2020 20:01
Biology, 03.09.2020 20:01
Chemistry, 03.09.2020 20:01


History, 03.09.2020 20:01


Mathematics, 03.09.2020 20:01


