
Biology, 22.01.2021 01:30 lillysiege
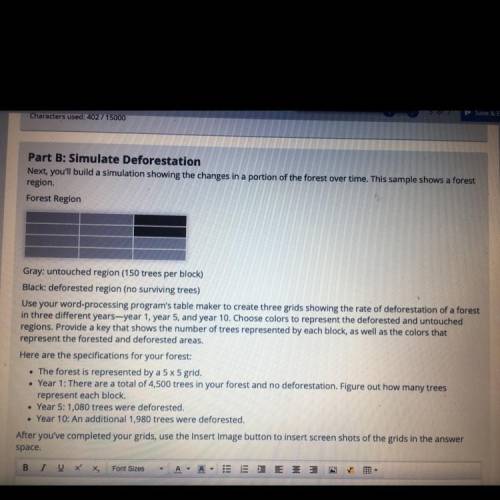
Next, you'll build a simulation showing the changes in a portion of the forest over time. This sample shows a forest
region.
Forest Region
Gray: untouched region (150 trees per block)
Black: deforested region (no surviving trees)
Use your word-processing program's table maker to create three grids showing the rate of deforestation of a forest
in three different years-year 1, year 5, and year 10. Choose colors to represent the deforested and untouched
regions. Provide a key that shows the number of trees represented by each block, as well as the colors that
represent the forested and deforested areas.
Here are the specifications for your forest:
• The forest is represented by a 5 x 5 grid.
• Year 1: There are a total of 4,500 trees in your forest and no deforestation. Figure out how many trees
represent each block.
• Year 5: 1,080 trees were deforested.
• Year 10: An additional 1,980 trees were deforested.
After you've completed your grids, use the Insert Image button to insert screen shots of the grids in the answer
space.

Answers: 1


Other questions on the subject: Biology
Biology, 21.06.2019 14:40, Historyfinder
Are characterized by dry conditions, limited vegetation and wide temperature range. a.) tropical rain forests b.) deserts c.) grasslands d.) none of the above
Answers: 1
Biology, 22.06.2019 01:00, akitchen10
An example of internal feedback working to maintain homeostasis is your a. decreased respiration rate when you are studying b. decreased heart rate when you are sad c. increased respiration rate when your muscles need more oxygen d. increased heart rate when your lungs need more oxygen
Answers: 1
Biology, 22.06.2019 15:30, cheerthi16
What process creates gametes? a. fertilization b. mitosis c. meiosis
Answers: 2
You know the right answer?
Next, you'll build a simulation showing the changes in a portion of the forest over time. This sampl...
Questions in other subjects:

English, 19.07.2021 21:50

Mathematics, 19.07.2021 22:00
Biology, 19.07.2021 22:00

Mathematics, 19.07.2021 22:00
History, 19.07.2021 22:00


