The image shows a line graph.
Line graph
Which scientist is most likely to use this visual ai...

Biology, 06.01.2021 17:10 justinchou814
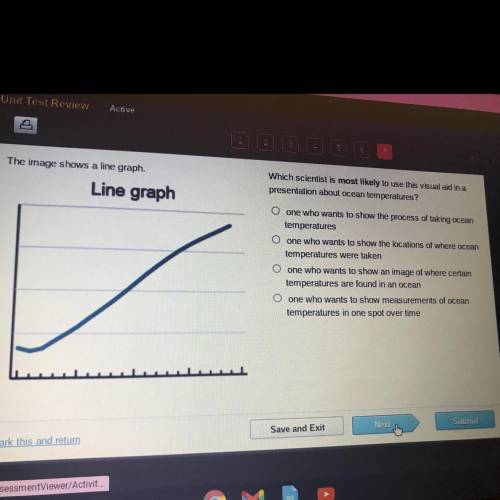
The image shows a line graph.
Line graph
Which scientist is most likely to use this visual aid in a
presentation about ocean temperatures?
O one who wants to show the process of taking ocean
temperatures
o one who wants to show the locations of where ocean
temperatures were taken
O one who wants to show an image of where certain
temperatures are found in an ocean
O one who wants to show measurements of ocean
temperatures in one spot over time

Answers: 2


Other questions on the subject: Biology
Biology, 22.06.2019 03:30, codycoker4200
What does the hardy-weinberg principle relate to? a. chances of survival of an organism b. frequency of alleles in a population c. natural selection in a species d. causes of evolution among organisms
Answers: 1
Biology, 22.06.2019 22:40, kelseybieberrr19
Following photosynthesis, is moved to the roots for storage through the phloem.
Answers: 1
You know the right answer?
Questions in other subjects:

Mathematics, 28.11.2021 18:20

Mathematics, 28.11.2021 18:30
Mathematics, 28.11.2021 18:30


