
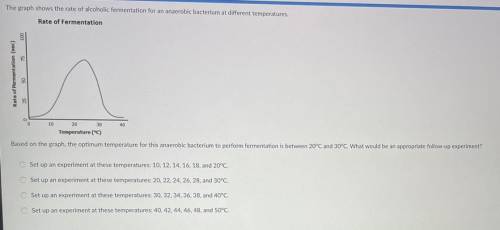
The graph shows the rate of alcoholic fermentation for an aerobic bacterium at different temperatures. Based on the graph, the optimum temperature for this anaerobic bacterium to perform fermentation is between 20 degrees C, and 30 degrees C. What would be an appropriate follow up experiment?

Answers: 1


Other questions on the subject: Biology
Biology, 21.06.2019 17:30, esnyderquintero
Look at the picture below . what does this picture represent ?
Answers: 1
Biology, 22.06.2019 10:30, isabellemaine
Differentiate renewable and nonrenewable resources
Answers: 1
You know the right answer?
The graph shows the rate of alcoholic fermentation for an aerobic bacterium at different temperature...
Questions in other subjects:

Social Studies, 18.07.2019 06:00


Mathematics, 18.07.2019 06:00

Computers and Technology, 18.07.2019 06:00

Geography, 18.07.2019 06:00
English, 18.07.2019 06:00


