
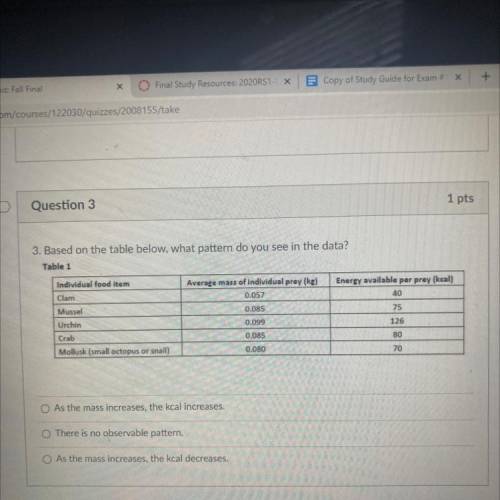
1 pts
Question 3
3. Based on the table below, what pattern do you see in the data?
Tabl...

Biology, 17.12.2020 17:50 shaakiraak
1 pts
Question 3
3. Based on the table below, what pattern do you see in the data?
Table 1
Energy available per prey (kcal)
40
75
Individual food item
Clam
Mussel
Urchin
Crab
Mollusk (small octopus or snail)
Average mass of individual prey (ke)
0.057
0.085
0.099
0.085
0.080
126
80
70
As the mass increases, the kcal increases.
There is no observable pattern.
O As the mass increases, the kcal decreases.

Answers: 2


Other questions on the subject: Biology
Biology, 22.06.2019 04:30, jesse7412
The picture showed normal blood cells which are around and sickle cells which appear much longer people with sickle-cell suffer from the sickle cell anemia which is inherited diseaseit is caused by a change in gene responsible for production of hemo goblin this type of change is known as an
Answers: 2
Biology, 22.06.2019 15:30, sarbjit879
Body temperature is tightly regulated in mammals for example when external temperatures drop too much the body of a mammal response by in order to it's core temperature.
Answers: 1
You know the right answer?
Questions in other subjects:

Mathematics, 21.10.2019 21:30


