
Biology, 10.12.2020 17:40 eternity88091
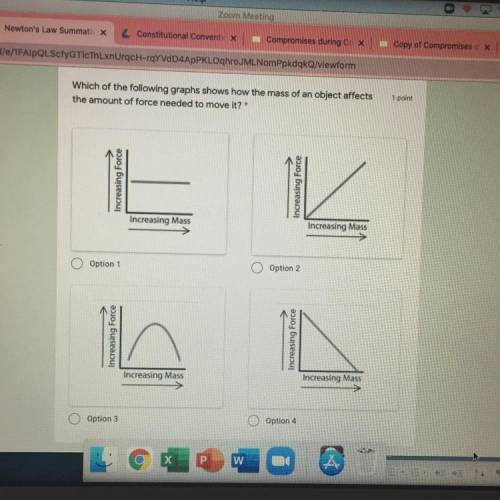
Which of the following graphs shows how the mass of an object affects the amount of force needed to move it???

Answers: 2


Other questions on the subject: Biology
Biology, 21.06.2019 20:30, Cocco
Dr. kaylan is an ecologist who studies bird behavior. she sets up an experiment to test which type of food crows are most likely to eat when given a choice between walnuts, corn, and sunflower seeds. to perform her experiment, dr. kaylan places three food bins in an area frequented by cows. each bin contains one of the three food types. then, she measures how much of each food type is eaten every day for a month and summarizes the results of her experiment in the pie chart below. based on her results, dr. kaylan concludes that crows choose to eat corn more frequently than other food sources because it has a higher nutritional value. what is a reasonable alternate conclusion that can be drawn from dr. kaylan's data
Answers: 2
Biology, 22.06.2019 00:00, BreBreDoeCCx
Twind is considered to be an abiotic factor because it.?
Answers: 1
Biology, 22.06.2019 01:30, eguilford4438
Scenario 5 1) take 10 red and 10 black beans and place them, mixed, on the table. record the starting phenotype # and frequencies (% of your total population) of your starting population in the table provided (generation 0). 2) act as a predator. “capture” as many organisms as you can until you have reduced the population to three organisms. put them aside. at this point, the predators die. 3) the remaining organisms each produce 2 clonal offspring. multiply your organisms accordingly and allow them to mix on the table. calculate and record the resultant phenotype # and frequencies (% of your total population) of your population in the table provided (generation 1). 4) repeat the reproduction event, allowing each of your organisms to produce 2 clonal offspring. calculate and record the resultant phenotype # and frequencies (% of your total population) of your population in the table provided (generation 2). 5) repeat the reproduction event, allowing each of your organisms to produce 2 clonal offspring. calculate and record the resultant phenotype # and frequencies (% of your total population) of your population in the table provided (generation 3).
Answers: 1
Biology, 22.06.2019 02:30, Destinywall
Did you know that a single bee would have to go to over 2 million flowers to make a single pound of honey?
Answers: 1
You know the right answer?
Which of the following graphs shows how the mass of an object affects the amount of force needed to...
Questions in other subjects:

Mathematics, 30.10.2020 17:00

Mathematics, 30.10.2020 17:00
Mathematics, 30.10.2020 17:00


