
Biology, 18.11.2020 07:20 NidaFurqan
Analyze the results by answering the following questions. You may wish to do some reading in your text or on the web about human survivorship to help you in formulating quality responses.
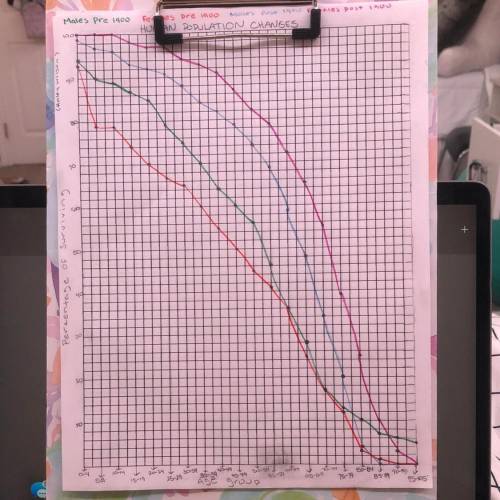
Compare the survivorship curves for males against those for females.
Explain the differences and why they occur.
Suggest possible biological and social/historical causes. For example, evolutionary
theory implies that females in the child-bearing years suffer higher mortality from childbirth deaths. How and in what periods do your data reflect this tendency?
Describe changes in mortality for males as a result of war.
Analyze and compare the mortality rates for the older age groups.
In general, why should these rates be higher than the average?
If you did not make a survivor curve for a nineteenth- century population, predict
how it would differ in three ways from the more recent population data you did plot.
If you did plot an additional curve from the nineteenth century, describe and explain
how if differs in three ways from the other one you plotted.
Describe how the survivorship curves of a more developed country (MDC) might compare to those of a less developed country (LDC).
Discuss how the survivorship curves could be used to make judgments about environmental and health conditions in each of the countries.
Humans are generally classified as forming a Type 1 survivorship curve.
Describe what this means.
Name some other organisms other than humans that are generally Type 1.
What are some distinguishing characteristics of Type 1 organisms?

Answers: 2


Other questions on the subject: Biology
Biology, 22.06.2019 06:50, naomi20044
What condition is kept close to its set point in osmoregulation? a. body temperature b. platelet count c. blood glucose level d. water balance
Answers: 1
Biology, 22.06.2019 06:50, dukkchild666
How many chromosomes does each human cell contain? a. 23 chromosomes b. 26 chromosomes c. 43 chromosomes d. 46 chromosomes
Answers: 2
Biology, 22.06.2019 11:00, ellieballinger9364
3what is the range of the function shownin the graph? ucation solutionsnw novo-9-8-7 -6 -5 -4 -3 -2 -1123456789
Answers: 1
You know the right answer?
Analyze the results by answering the following questions. You may wish to do some reading in your te...
Questions in other subjects:

Chemistry, 17.09.2019 01:30
Chemistry, 17.09.2019 01:30

English, 17.09.2019 01:30

Mathematics, 17.09.2019 01:30
Mathematics, 17.09.2019 01:30

History, 17.09.2019 01:30
Mathematics, 17.09.2019 01:30
History, 17.09.2019 01:30


