
Biology, 09.11.2020 20:30 rebekah2503
Which Biome?
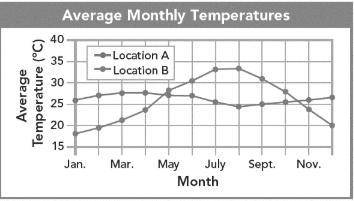
An ecologist collected climate data from two locations. The graph shows the monthly average temperatures in the two locations. In Location A, the total yearly precipitation is 273 cm. In Location B, the total yearly precipitation is 11 cm.
1. Analyze Graphs What specific question is this graph addressing?
2. Analyze Graphs Use the graph as evidence to draw a conclusion about the temperature over the course of the year in Location A and Location B.
3. Apply Scientific Reasoning In which biome would you expect to find each location, given the precipitation and temperature data? Use scientific reasoning to explain your answer.
4. Construct Graphs Look up the average monthly temperature last year for your community. Construct a graph and plot the data. Then, research the monthly rainfall for your city, and plot those data on your graph. Based on your results, which biome do you live in? Did the data predict the biome correctly?

Answers: 3


Other questions on the subject: Biology
Biology, 21.06.2019 21:30, BigGirlsTheBest
Out of the seven main animal groups (fish, mammals, birds, insects, reptiles, amphibians, and arachnids), how many contain members with internal backbones? a. 5 b. 3 c. 7 d. 1
Answers: 1
Biology, 22.06.2019 05:30, johniyabrown26
Which event would lead to primary succession of a forest?
Answers: 1
You know the right answer?
Which Biome?
An ecologist collected climate data from two locations. The graph shows the monthly av...
Questions in other subjects:


History, 13.07.2019 05:00

Mathematics, 13.07.2019 05:00

Chemistry, 13.07.2019 05:00


