
Biology, 07.11.2020 21:20 rbeltran24
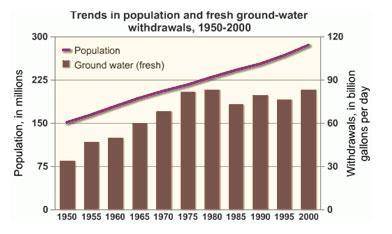
Which of the following is not a correct statement about the graph?
A. Groundwater withdrawal peaked in 1980 and 2000.
B. From 1950 to 2000, groundwater withdrawal increased steadily.
C. The biggest decline in groundwater withdrawal occurred between 1980 and 1985.
D. The population in the United States appears to increase at a linear rate from 1950 to 2000.

Answers: 1


Other questions on the subject: Biology
Biology, 22.06.2019 03:00, annamcveigh50
Asap. this question is 100 points if you answer it question: describe the basic relationship between ocean depth and temperature seen in the graph
Answers: 1
Biology, 22.06.2019 12:30, tiarafaimealelei
This is collection of data made by comparing objects in standard units. in science, the units are metric.
Answers: 3
You know the right answer?
Which of the following is not a correct statement about the graph?
A. Groundwater withdrawal peaked...
Questions in other subjects:


