
Biology, 06.11.2020 05:50 amariciara05
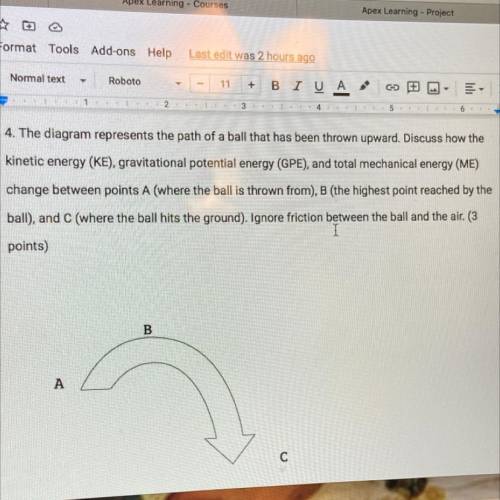
4. The diagram represents the path of a ball that has been thrown upward. Discuss how the
kinetic energy (KE), gravitational potential energy (GPE), and total mechanical energy (ME)
change between points A (where the ball is thrown from), B (the highest point reached by the
ball), and C (where the ball hits the ground). Ignore friction between the ball and the air. (3
points)

Answers: 3


Other questions on the subject: Biology
Biology, 21.06.2019 13:00, keigleyhannah30
Which of the following are energy solutions that release pollution into the air>
Answers: 1
Biology, 21.06.2019 19:40, HannyBun
Asmall number of finches are removed randomly from the wild and placed in a protected bird area. they are given as much food as they need and have plenty of space. why would natural selection not occur in this population? a. there is no reason for genetic mutation to occur. b. the birds compete for limited resources, c. the population has not reached carrying capacity. d. there is no genetic variation in the finches.
Answers: 1
Biology, 22.06.2019 01:30, eguilford4438
Scenario 5 1) take 10 red and 10 black beans and place them, mixed, on the table. record the starting phenotype # and frequencies (% of your total population) of your starting population in the table provided (generation 0). 2) act as a predator. “capture” as many organisms as you can until you have reduced the population to three organisms. put them aside. at this point, the predators die. 3) the remaining organisms each produce 2 clonal offspring. multiply your organisms accordingly and allow them to mix on the table. calculate and record the resultant phenotype # and frequencies (% of your total population) of your population in the table provided (generation 1). 4) repeat the reproduction event, allowing each of your organisms to produce 2 clonal offspring. calculate and record the resultant phenotype # and frequencies (% of your total population) of your population in the table provided (generation 2). 5) repeat the reproduction event, allowing each of your organisms to produce 2 clonal offspring. calculate and record the resultant phenotype # and frequencies (% of your total population) of your population in the table provided (generation 3).
Answers: 1
You know the right answer?
4. The diagram represents the path of a ball that has been thrown upward. Discuss how the
kinetic e...
Questions in other subjects:

Mathematics, 20.05.2020 14:58


Mathematics, 20.05.2020 14:58
Mathematics, 20.05.2020 14:58
Mathematics, 20.05.2020 14:58


