
Biology, 20.10.2020 03:01 ashleylit8
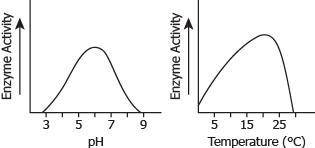
The graph shows the activity of an enzyme at different pH levels and temperatures, What can be inferred by looking at the graphs?

Answers: 1


Other questions on the subject: Biology
Biology, 21.06.2019 21:20, zay65307
Atypical human cell is approximately 12.00 μm in diameter and enclosed by a membrane that is 5.000 nm thick. (a) what is the volume of the cell including the membrane? (b) what is the volume of the cell membrane? (c) what percent of the total volume does its membrane occupy? to simplify the calculations, model the cell as a sphere. enter your answers using four significant figures.
Answers: 3
Biology, 22.06.2019 11:00, DuckieTime
If a grape were placed in a hypertonic solution what would happen and why?
Answers: 1
Biology, 22.06.2019 17:40, lizzbugg9880
Which is abiotic? a. tree sap b. insect c. sunlight d. wood table
Answers: 2
Biology, 22.06.2019 18:20, inesperezferrere
Hey everybody, i have another biology question. by what reproductive mechanism does a haplontic animal grow? initially mitosis, then meiosis completely by mitosis completely by meiosis initially by meiosis, then by mitosis
Answers: 2
You know the right answer?
The graph shows the activity of an enzyme at different pH levels and temperatures, What can be infer...
Questions in other subjects:


