
PLEASE HELP
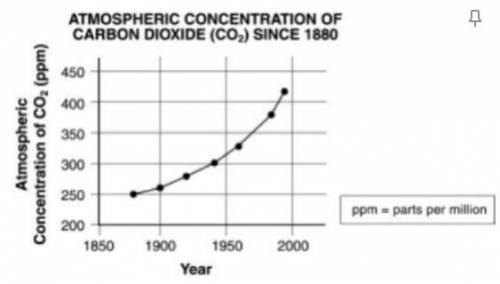
The graph below shows atmospheric carbon dioxide levels since the year 1880. Which of the following conclusions can be drawn from this graph?
A.) Atmospheric carbon dioxide levels are responsible for global temperature change.
B.) Atmospheric carbon dioxide levels have been rising at about the same rate for the past century.
C.) Atmospheric carbon dioxide levels have remained the same over the past century.
D.) Atmospheric carbon dioxide levels have been rising at an increasingly higher rate as the past century has progressed.

Answers: 1


Other questions on the subject: Biology
Biology, 21.06.2019 19:00, TH3L0N3W0LF
Consider the diagram below, which represents components of the biosphere. what do the two arrows in the diagram most likely represent? a. radiation b. photosynthesis c. cellular respiration d. energy conversions will give to anyone who answers quickly
Answers: 1
Biology, 22.06.2019 03:00, Wolfzbayne
Johnny rode his bike to a friend's house 4 blocks down the street in his neighborhood. he immediately rode back home once he realized his friend was not able to play. what was his displacement for the total bike ride? how did you determine this? what could we use as a reference point to determine he was in motion during his bike ride? why can you use it as a reference point
Answers: 1
Biology, 22.06.2019 10:30, haileyw123
Ras is a g-protein that is activated when a growth factor attaches to egfr. its activation results in the replacement of a gdp molecule with a gtp molecule, thus allowing a signal transduction pathway to be activated. considering the signal pathway illustrated on this page, what is one potential outcome of a mutation in the ras gene that leads to ras protein hyperactivity. be specific.
Answers: 3
You know the right answer?
PLEASE HELP
The graph below shows atmospheric carbon dioxide levels since the year 1880. Which of t...
Questions in other subjects:


