
I’ll mark The graph illustrates the trend in number of species in two different ecosystems. Select the statements that are supported by the data on the changes in each ecosystem.
Ecosystem 1 has more abundant and consistent resources.
The rate of decrease in the number of species in ecosystem two reflects a disruption of the food web.
Ecosystem one has a broad range of trophic levels providing more stability.
Ecosystem two has fewer ecological niches which limits the ability of species to adapt to change.
The number of species in ecosystem two will increase if there are no further changes in the environment.
The biodiversity of ecosystem one is a result of a lack of apex predators.
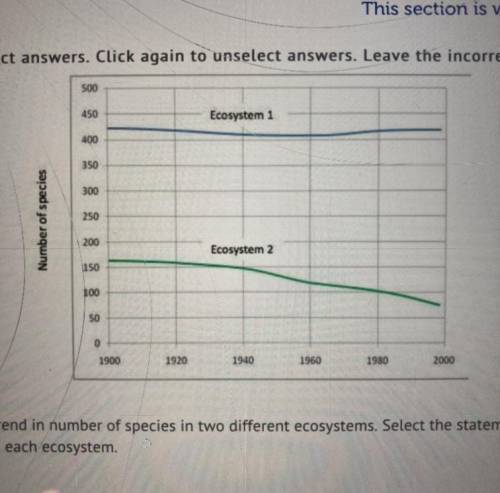

Answers: 2


Other questions on the subject: Biology
Biology, 22.06.2019 01:00, leomessifanboy678
Why would a drug the damages capsids treat a viral infection
Answers: 1
Biology, 22.06.2019 14:30, brendaesme
49 ! how are energy cycles and growth cycles related?
Answers: 1
Biology, 22.06.2019 16:30, CoreyHammond74901
Astudent sees several ants walking up a wall following the exact same trail that an ant took earlier. she wants to apply the scientific method to determine how the ants detected the trail. which of these steps would come first in her application of the scientific method? perform an experiment by cleaning the scent away from part of the trail. draw a conclusion that the ants follow a scent trail. make a prediction about what the ants will do after she cleans away part of the trail. hypothesize that the ants are following a scent trail that the first ant left.
Answers: 1
Biology, 22.06.2019 18:30, Demondevilg
Support mangrove trees out of the water. a) pneumatophores b) prop roots c) sand dunes d) tide supports
Answers: 1
You know the right answer?
I’ll mark The graph illustrates the trend in number of species in two different ecosystems. Select t...
Questions in other subjects:

Mathematics, 17.01.2020 05:31

Mathematics, 17.01.2020 05:31
Physics, 17.01.2020 05:31

Biology, 17.01.2020 05:31


