
Biology, 16.10.2020 07:01 andrejr0330jr
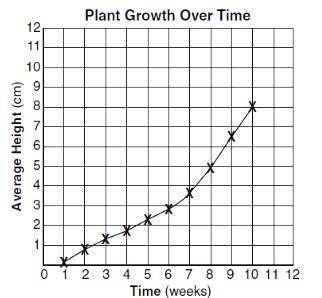
The graph shows the results of an experiment that tested the effect of time on plant growth. A student measured the height of the several plants for ten weeks and determined the average height. The results are shown in the graph below. According to the graph, what is the average height of the plants at week 9? _ cm.

Answers: 3


Other questions on the subject: Biology
Biology, 21.06.2019 23:30, lovelybear2354
Tara sees a commercial for a brand of pills that promise to boost energy and people perform better in work and school. as people in the commercial talk about how much better they feel when taking the pill, tara notices a message on the bottom of the screen that reads, "this pill is not approved by doctors and has not been tested in controlled experiments." what is the best conclusion that tara should make about the commercial? it is making scientific claims based on subjective observations. it is making scientific claims based on opinions instead of pseudoscientific facts. it is making pseudoscientific claims based on objective observations. it is making pseudoscientific claims based on opinions instead of scientific facts.
Answers: 1
Biology, 22.06.2019 11:20, maddiecrouch21
Drag each label to the correct location on the chart. match the function to the type of tissue
Answers: 2
You know the right answer?
The graph shows the results of an experiment that tested the effect of time on plant growth. A stude...
Questions in other subjects:


Health, 27.02.2021 22:30


