
Biology, 18.08.2020 22:01 tomuchsaucecj
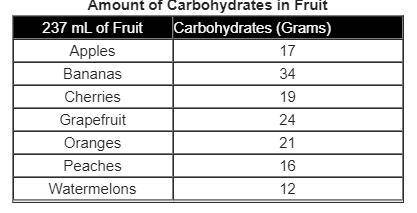
The table below shows the amount of carbohydrates in similar servings of different fruits. Amount of Carbohydrates in Fruit 237 mL of Fruit Carbohydrates (Grams) Apples 17 Bananas 34 Cherries 19 Grapefruit 24 Oranges 21 Peaches 16 Watermelons 12 If this data was placed in a bar graph, which statement would describe the graph? The graph would have only four bars shorter than the bar for grapefruits. The graph would have five bars taller than the bar for apples. The graph would have grapefruits and oranges as the tallest bars. The graph would have only one bar shorter than the bar for peaches.

Answers: 2


Other questions on the subject: Biology
Biology, 21.06.2019 16:00, english8971
Why was the sample heated in step 5? describe the chemical principles involved in the reasoning behind this step?
Answers: 2
Biology, 22.06.2019 03:00, mariaaalopezz
Discuss the functions of epithelial connective nerviud and muscular tissues
Answers: 3
Biology, 22.06.2019 07:00, Bengynease2598
An ecologist studied the same species of deer during the summer and the winter. she noticed that during the summer, when there was plenty of food, the deer were energetic and playful. however, during winter when food was scarce, the deer moved more slowly and did not run unless they needed to escape a predator. which scientific fact is best supported by her observations?
Answers: 3
You know the right answer?
The table below shows the amount of carbohydrates in similar servings of different fruits. Amount of...
Questions in other subjects:

Mathematics, 03.03.2021 16:50


Arts, 03.03.2021 16:50

Geography, 03.03.2021 16:50


