
Biology, 15.07.2020 01:01 tiffxnnyyy
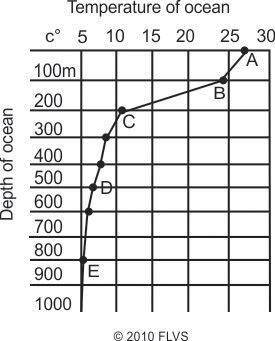
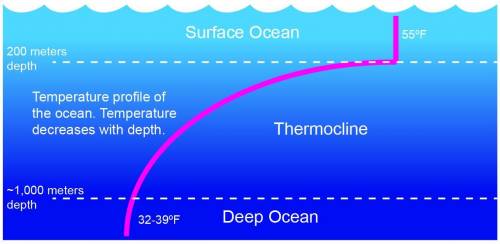
The graph below shows the temperature of ocean water at different depths. Which part of the graph represents the thermocline? a. AB b. BC c. CD d. DE

Answers: 3


Other questions on the subject: Biology
Biology, 22.06.2019 01:00, sbailey0962
How does this experiment explain why it is often milder in areas such as coastal maryland while areas such as kansas or iowa have more extremes in temperature
Answers: 3
Biology, 22.06.2019 05:00, jxcxhxwxll
The chemical form of energy that is useable by the cell to do work
Answers: 2
Biology, 22.06.2019 06:50, naomi20044
What condition is kept close to its set point in osmoregulation? a. body temperature b. platelet count c. blood glucose level d. water balance
Answers: 1
Biology, 22.06.2019 11:00, eweqwee3147
Fill in the blank 1. digestion occurs in the small intestine through the action of enzymes. 2. urea, excess water, and other waste materials are eliminated in a water fluid called 3. can cause infections by injecting dna or rna into hosts. 4. the human immune system produces in response to a vaccine, which later can bind to and destroy a pathogen if it invades. 5. are structures that link bone to bone at a joint 6. in the heart, blood flows from the right atrium to the right ventricle, where it is pumped to the the words i can use are: lymphocytes gliding pivot gas urine absorption dermis fulcrum lungs chemical viruses capillary vertebrae esophagus tendons antibodies synapses ligaments kidneys pathogens
Answers: 1
You know the right answer?
The graph below shows the temperature of ocean water at different depths. Which part of the graph re...
Questions in other subjects:

Health, 26.06.2019 07:30


Computers and Technology, 26.06.2019 07:30


