D
с
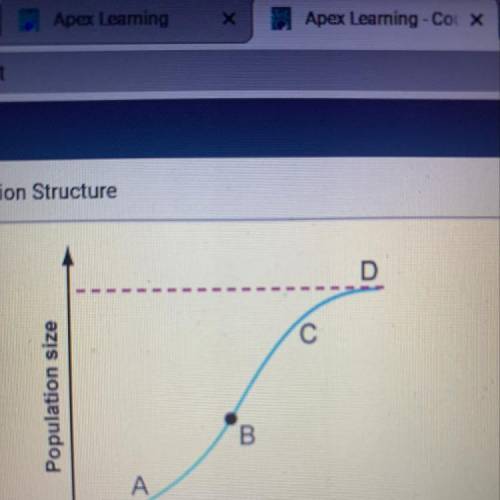
Population size
B
A
Time
Where is the growth rate slowing down in...

Biology, 26.06.2020 16:01 ammullims822
D
с
Population size
B
A
Time
Where is the growth rate slowing down in the graph shown above?
O A. Point D
B. Point
O C. Point B
D. Point A

Answers: 3


Other questions on the subject: Biology
Biology, 21.06.2019 22:30, charmrenee
What are the result of when individual components in an organism interact with others to create noval stucture and function called
Answers: 2
Biology, 22.06.2019 07:30, stefkellum58
Match the reproductive structures based on their function and the system to which they belong. egg ovary sperm vas deferens vagina fallopian tube testis urethra
Answers: 1
Biology, 22.06.2019 11:00, Loliii
Membrane vesicles containing an internal sodium chloride (nacl) concentration of 0.14 m are placed into separate beakers each containing a different solution. the first beaker contains 0.14 m sucrose, while the second beaker contains 0.14 m calcium chloride (cacl2). the temperature is 25°c. what is the solute potential inside the vesicles, expressed in units of mpa?
Answers: 2
You know the right answer?
Questions in other subjects:


Mathematics, 26.08.2021 23:30
Biology, 26.08.2021 23:30

Computers and Technology, 26.08.2021 23:30

Mathematics, 26.08.2021 23:30

English, 26.08.2021 23:30


