
Biology, 24.05.2020 00:04 germainenez3288
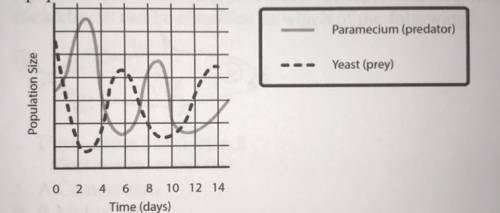
The graph provided presents information on changes in the populations of a predator and its prey over time. Which of the following best explains the increases and decreases in the predator population?
A. A There were variations in the food supply.
B. B Predators migrate frequently.
C. C The paramecium competed with the yeast.
D. D Populations always achieve a stable level.

Answers: 2


Other questions on the subject: Biology
Biology, 22.06.2019 02:30, usagimiller
What evidence supports the law of conservation of energy? a) mechanical energy is converted to chemical energy during photosynthesis. b) oxygen is made from the breakdown of carbon dioxide during photosynthesis. c)energy is absorbed by chlorophyll and becomes chemical energy during photosynthesis. d)the sun gives off light energy that is absorbed by plants.
Answers: 1
Biology, 22.06.2019 04:30, 20brooklyn22
The specific heat of ice is 0.5 calories/gram°c. 20 grams of ice will require ll calories to raise the temperature 1°c. 05
Answers: 1
Biology, 22.06.2019 10:30, yaya111601
A(n) is a molecule influences the way that a molecule reacts.
Answers: 1
Biology, 22.06.2019 12:30, sarahpaigeallen
How do all types of diffusion/passive transport actually ‘work’ without using even the smallest amount of cellular energy?
Answers: 1
You know the right answer?
The graph provided presents information on changes in the populations of a predator and its prey ove...
Questions in other subjects:

Mathematics, 25.08.2019 17:30
Mathematics, 25.08.2019 17:30


History, 25.08.2019 17:30
Mathematics, 25.08.2019 17:30
History, 25.08.2019 17:30


