
Biology, 23.05.2020 18:57 elenagarcia123
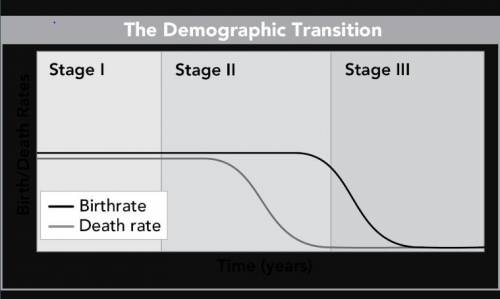
Demographers use graphs like this one to analyze patterns of population growth and decline.
The graph plots birthrate and death rate over time, in years. In Stage I, both rates begin relatively high. In Stage II, birth rate remains high while death rate decreases. At the end of Stage II and into Stage III, birthrate decreases to match the low death rate.
As Suzie conducts additional research on demography, she researches data on population growth in several countries.* Which of these steps would be most effective in assuring the accuracy of the data?*
A. Make sure that many sources agree with the data, and ignore sources that provide conflicting information.
B. Only cite sources that are trusted by the general public, such as popular magazines and newspapers.
C. Make sure data is provided by a reliable source, such as a government agency, a scientific journal, or a respected organization of scientists.
D. Only cite data that is at least 10 years old, because it is more likely to have been tested and be reliable than more recent data.

Answers: 3


Other questions on the subject: Biology
Biology, 21.06.2019 17:00, mauralawson
In tossing one coin 10 times, what are your chances for tossing a head? a tail? 2. in tossing one coin 100 times, what are your chances for tossing a head? a tail? 3. in tossing one coin 200 times, what are your chances for tossing a head? a tail? deviation = ((absolute value of the difference between expected heads and observed heads) + (absolute value of the difference between expected tails and observed tails)) divided by total number of tosses. this value should always be positive. 4. what is the deviation for 10 tosses? 5. what is the deviation for the 100 tosses? 6. what is the deviation for 200 tosses? 7. how does increasing the total number of coin tosses from 10 to 100 affect the deviation? 8. how does increasing the total number of tosses from 100 to 200 affect the deviation? 9. what two important probability principles were established in this exercise? 10. the percent of occurrence is the obtained results divided by the total tosses and multiplied by 100%. toss the coins 100 times and record your results. calculate the percent occurrence for each combination. percent head-head occurrence: percent tail-tail occurrence: percent head-tail occurrence:
Answers: 1
Biology, 22.06.2019 09:00, ittmanny6138
Recommend a strategy for incorporating sustainable human activity into a tropical rain forest biome.
Answers: 1
Biology, 22.06.2019 11:00, jimissac68
Which statement correctly describes other ways in which nebulae and stars are different? a. a star always has a higher density than a nebula. b. stars can form inside a nebula but a nebula can never be produced by any star. c. stars can never form inside a nebula but a nebula can be produced by any star. d. a nebula always has a higher density than a star. reset submit
Answers: 3
Biology, 22.06.2019 13:50, allieballey0727
The serengeti plains are part of the african savanna ecosystem and are home to a variety of different species of plants and animals. the serengeti plains experience a seven-month period of seasonal drought each year, during which the ecosystem receives only four inches of rain and the availability of some resources becomes very scarce. which type of limiting factors does the seasonal drought in the serengeti plains affect?
Answers: 2
You know the right answer?
Demographers use graphs like this one to analyze patterns of population growth and decline.
Questions in other subjects:

Business, 10.02.2021 22:30

Mathematics, 10.02.2021 22:30

Social Studies, 10.02.2021 22:30

Physics, 10.02.2021 22:30
Mathematics, 10.02.2021 22:30

History, 10.02.2021 22:30
Mathematics, 10.02.2021 22:30


