The levels of the diagram are labeled with percentages. What do the percentages represent?
A....

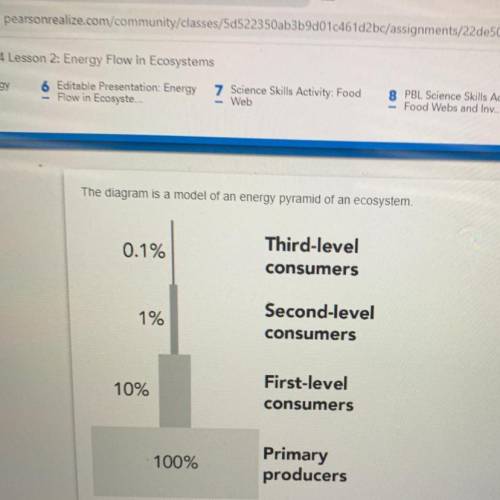
The levels of the diagram are labeled with percentages. What do the percentages represent?
A. the average energy requirement of organisms in each trophic level
O
B. the relative amounts of energy contained by the organisms in each trophic level
O
c. the energy lost as heat from one trophic level to the next
D. the rate of conversion of light energy to chemical energy
Review prograce

Answers: 2


Other questions on the subject: Biology
Biology, 22.06.2019 07:30, reganjones89
When listening the levels of orginization in orginisims from the smallest to most complex , which level is just below organs in complexity
Answers: 1
Biology, 22.06.2019 11:00, jasramos004
Across of blue x blue (both heterozygous) would result in
Answers: 3
Biology, 22.06.2019 16:00, postorivofarms
Which of these outcomes is a negative impact of postindustrial societies on the environment? a. nomadic ways b. overpopulation c. overgrazing d. resource renewal
Answers: 3
Biology, 22.06.2019 16:30, leannesmith90101
You will create a molecular clock model for an arthropod gene. follow these guidelines to make your model: . your timeline will span from 90 million years ago to the present. the common ancestor in your model is an arthropod that lived 90 million years ago. the gene that you'll track codes for a protein in the species venom . the dna sequence youll track contains 10 nitrogen bases. you can choose the order of the bases and where the mutations occur. this gene mutates at a rate of approximately 0.76 base pairs every 17.1 million years. to build your model,/ calculate the estimated time period it takes for 1 base pair to mutate. the first time period will only show the common ancestor. at the beginning of the second time period, three lineages will diverge from the common ancestor, each with a different mutation in their gene sequences. the first and third descendant species will survive for the rest of the timeline. the second descendant species was extinct 50 million years ago. calculate how long it will take for one full base pair mutation to occur. explain your reasoning by constructing a mathematical equation
Answers: 2
You know the right answer?
Questions in other subjects:


Chemistry, 25.02.2020 03:33

Mathematics, 25.02.2020 03:33
Mathematics, 25.02.2020 03:33
Mathematics, 25.02.2020 03:33


