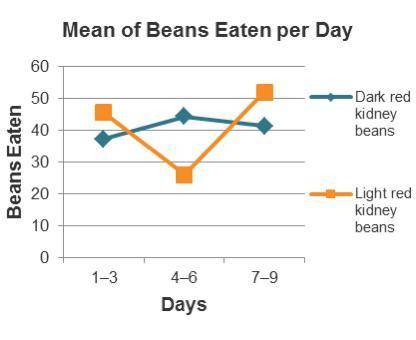
This is a graph of the mean, or average, number of beans eaten for every three days.
During Da...

Biology, 31.03.2020 22:02 brittanysanders
This is a graph of the mean, or average, number of beans eaten for every three days.
During Days 1–3, more red kidney beans were eaten.
During Days 4–6, more red kidney beans were eaten.
During Days 7–9, more red kidney beans were eaten.

Answers: 2


Other questions on the subject: Biology
Biology, 20.06.2019 18:04, kiyahlove7537
Chlorophyll is a green pigment that is found in which are closely related. a) fungi and plants b) green algae and plantlike protists c) plants and plantlike protists d) plants and green algae
Answers: 1
Biology, 22.06.2019 02:50, alannalizettep8trnj
How does upwelling affect coastal fisheries? upwelling damages nutrient supplies at coastal fisheries as the warm, nutrient-rich surface water is replaced by nutrient-poor, cold water. upwelling damages nutrient supplies at coastal fisheries as the cold, nutrient-rich surface water is replaced by nutrient-poor, warm water. upwelling improves the nutrient supply at coastal fisheries as the warm, nutrient-rich surface water replaces the nutrient-poor, cold water. upwelling improves the nutrient supply at coastal fisheries as cold, nutrient-rich water replaces the warm, nutrient-poor surface water.
Answers: 3
Biology, 22.06.2019 06:10, avonsluv8809
Aresearcher designed an investigation to test what effect eating different types of food would have on blood insulin levels. she selected 10 male subjects who were all 25 years of age and in good health. the experiment took place over 3 days. at 8: 00 a. m. on each day, the subjects ate a meal consisting of only 1 type of food. they had their blood insulin levels measured after consuming the meal. on day 1 they ate a high fat diet, on day 2 they ate a high protein diet, and on day 3 they ate a high sugar diel what is the independent variable in this experiment? a the age of the subjects b the blood insulin level c the type of food consumed d the time of day the meal was consumed
Answers: 2
You know the right answer?
Questions in other subjects:


Biology, 22.05.2021 05:50
Mathematics, 22.05.2021 05:50
Mathematics, 22.05.2021 05:50
Mathematics, 22.05.2021 05:50

History, 22.05.2021 05:50


