The following curve shows the distribution of the masses of the individuals in
a population of...

Biology, 27.02.2020 09:48 ayoismeisjjjjuan
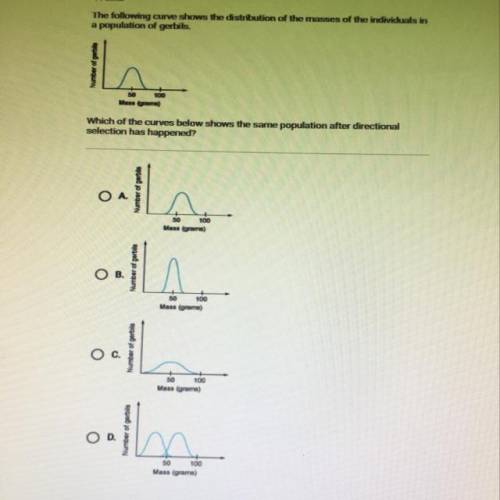
The following curve shows the distribution of the masses of the individuals in
a population of gerbils.
Number of gerbile
Mass (grams)
Which of the curves below shows the same population after directional
selection has happened?

Answers: 3


Other questions on the subject: Biology
Biology, 21.06.2019 23:00, taylabrown2013
If the frequency of the p allele is .63 in the population then what is the frequency of the q allele?
Answers: 1
Biology, 22.06.2019 10:40, ilovecatsomuchlolol
_is a product of the first stage of photosynthesis. atpglucosecarbon dioxidewater
Answers: 2
You know the right answer?
Questions in other subjects:

English, 26.01.2021 14:00

Mathematics, 26.01.2021 14:00


Biology, 26.01.2021 14:00
Mathematics, 26.01.2021 14:00

Chemistry, 26.01.2021 14:00


