
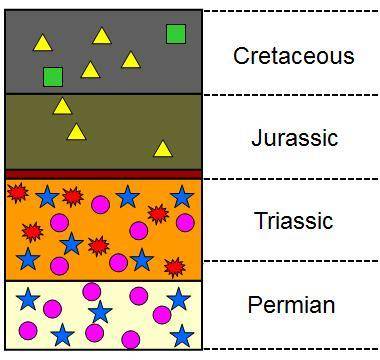
The diagram below represents a series of rock layers from a single location. Each different type of shape shown in the layers represents a fossil of a different species.
Suppose the blue star represents a certain fish species. When did this species go extinct at this location?
A.
at the end of the Jurassic
B.
at the end of the Cretaceous
C.
at the end of the Triassic
D.
during the Permian

Answers: 1


Other questions on the subject: Biology
Biology, 22.06.2019 08:00, shantrice1831
What is the ecological role of food chains and food webs
Answers: 3
Biology, 22.06.2019 15:30, adriannacomrosenbark
The most effective way to provide children with safety messages is to
Answers: 3
You know the right answer?
The diagram below represents a series of rock layers from a single location. Each different type of...
Questions in other subjects:


Mathematics, 28.07.2019 02:30

Advanced Placement (AP), 28.07.2019 02:30

Chemistry, 28.07.2019 02:30

English, 28.07.2019 02:30


