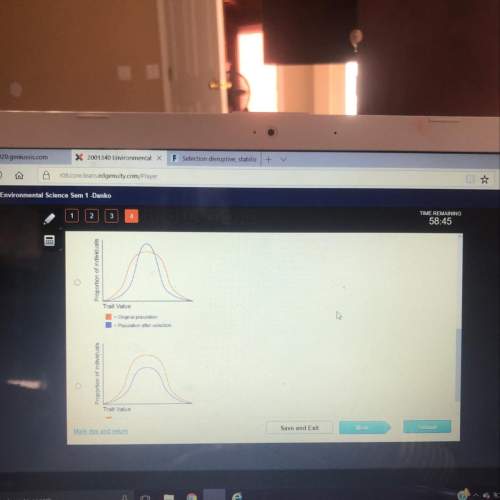
Which graph represents selection that may lead to reduced variation in a population?
proporti...


Answers: 2


Other questions on the subject: Biology
Biology, 22.06.2019 12:30, musa79
Which of the following observation darwin shape his concept of descent with modification? a) species diversity declines farther from the equator. b) fewer species live on islands than on the nearest continents. c) birds live on islands located farther from the mainland than the bird's maximum nonstop flight distance. d) south american temperate plants are more similar to the tropical plants of south america than to the temperate plants of europe. e) earthquakes reshape life by causing mass extinctions.
Answers: 1
Biology, 22.06.2019 15:30, viktoria1198zz
Which of these would most likely be a stimulus that would cause the body to initiate feedback mechanisms a.) normal body temperature in an arctic environment b.) normal boy temperature in a tropical environment c.)light physical activity d.)low blood sugar
Answers: 2
You know the right answer?
Questions in other subjects:


