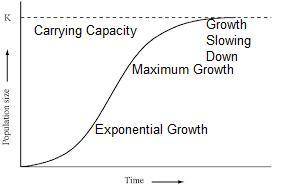
The graph below shows the population of a species over time.
population size
time
...

Biology, 25.11.2019 02:31 leopolesamoy
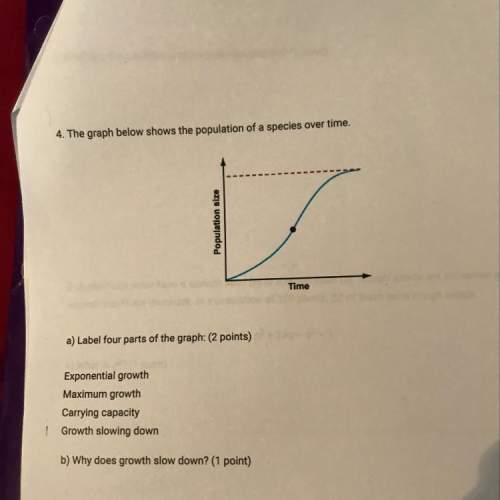
The graph below shows the population of a species over time.
population size
time
a) label four parts of the graph:
exponential growth
maximum growth
carrying capacity
growth slowing down
b) why does growth slow down?

Answers: 1


Other questions on the subject: Biology
Biology, 22.06.2019 03:30, lildanielmabien
How can a geological time scale best be reconstructed? a) comparing vestigial structures in living species b) comparing homologous structures in living species c) examining homologous structures in fossil remains d) examining the written records of scientists from past cultures
Answers: 1
Biology, 22.06.2019 16:00, magicalunicorns47
Produce proteins by following coded instructions that come from the nucleus of the cell.
Answers: 3
You know the right answer?
Questions in other subjects:

Mathematics, 10.12.2021 02:40

Chemistry, 10.12.2021 02:40
Mathematics, 10.12.2021 02:40

Social Studies, 10.12.2021 02:40
Mathematics, 10.12.2021 02:40

History, 10.12.2021 02:40


