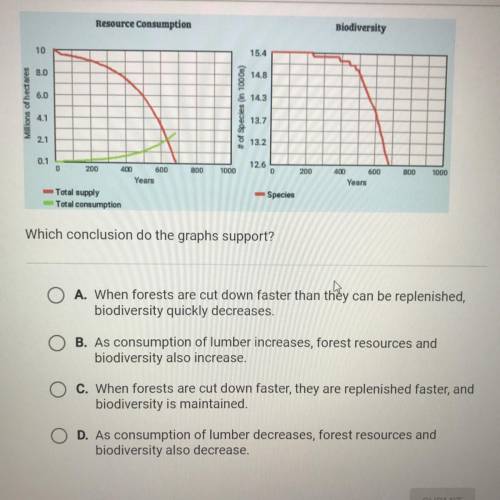
The graph on the left shows the total supply and consumption of forests
when the consumption r...

Biology, 16.10.2019 19:10 jetblackcap
The graph on the left shows the total supply and consumption of forests
when the consumption rate and population growth rate are both low. the
graph on the right shows land usage under the same conditions.

Answers: 2


Other questions on the subject: Biology
Biology, 22.06.2019 02:20, jothianddeepi
Humans are believed to have evolved in coastal regions in east africa. the region had an abundant supply of fish for early humanoids to eat. when scientists analyze the fads gene they see an interesting pattern. people whose families have lived in this area of east africa for generation show a high level of diversity in alleles for the fads gene. conversely, people whose families had migrated inland a moderate distance from sources of fish showed a much lower diversity for fads gene alleles. additionally, the fads alleles found in people whose family has lived inland for generation are almost all gene alleles which produce fads proteins with a high level of function and activity. how do anthropologists explain this?
Answers: 3
Biology, 22.06.2019 13:00, Brooke7644
In trying to determine whether dna or protein is the genetic material, hershey and chase made use of which of the following facts? a) dna contains sulfur, whereas protein does not. b) dna contains phosphorus, whereas protein does not. c) dna contains nitrogen, whereas protein does not. d) dna contains purines, whereas protein includes pyrimidines.
Answers: 3
Biology, 22.06.2019 17:00, malachitorres813
What are ways that ordinary people can to keep antibiotic resistance from getting worse?
Answers: 1
Biology, 22.06.2019 17:30, xxtonixwilsonxx
The krebs cycle is also known as the calvin cycle pyruvic acid cycle carbon - oxygen cycle citric acid cycle
Answers: 2
You know the right answer?
Questions in other subjects:


