
Biology, 21.11.2019 16:31 litwork5885
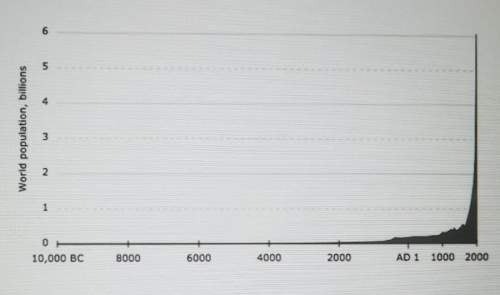
The graph illustrates the growth of human population since 10,000 b. c. which statement is not supported by the data in the graph?
a) human populations have been affected by limiting factors.
b) human population has increased dramatically over the last century.
c) most of the increases in human populations have happened recently.
d) human population growth very slowly over the first 8,000 years of human existence.

Answers: 2


Other questions on the subject: Biology
Biology, 22.06.2019 06:10, 21121212cutecheytown
Which process of living things produces water that enters the water cycle
Answers: 1
Biology, 22.06.2019 06:50, Shaylaharrison15
The kidney filters potentially toxic substances in the blood, and thus “clears” the blood of those substances. this clearance function is dependent upon and proportional to the diffusion gradient of the substance across filtering capillaries, i. e. if the concentration of the substance is doubled, twice as much will be cleared from each ml of blood that is filtered. suppose that the body produces a constant amount of a substance x per unit of time. the kidneys eliminate substance x at a rate directly proportional to the concentration of the substance and the volume of blood cleared each minute (c): elimination = c × [x], where [x] is the steady-state concentration of substance x. imagine an individual with an initial concentration of x equal to [x]0 who develops kidney disease. her baseline clearance c0 drops to one half of the original (½c0). what is the new steady state concentration of x? (for simplicity, assume that substance x is 100% filtered by the kidney).
Answers: 1
Biology, 22.06.2019 08:20, lizbethreyes5725
Which characteristics are typical of a human population in the postindustrial stage?
Answers: 3
You know the right answer?
The graph illustrates the growth of human population since 10,000 b. c. which statement is not suppo...
Questions in other subjects:


Mathematics, 22.08.2019 18:30

Social Studies, 22.08.2019 18:30
Mathematics, 22.08.2019 18:30

Computers and Technology, 22.08.2019 18:30


History, 22.08.2019 18:30
History, 22.08.2019 18:30


