
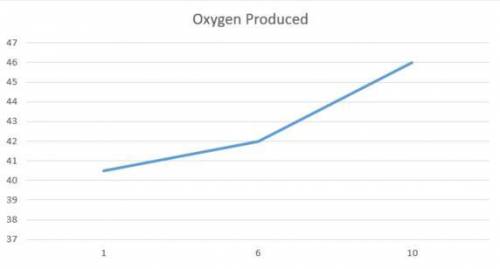
Gerald performed an experiment to determine if photosynthesis was affected by the amount of light that a plant received. the data from his experiment are shown in the table below.
amount of light number of plants average volume of oxygen
produced (ml)
(hours)
1 4 0.50
6 4 2.00
10 4 5.00
which format should he use to present his data?
bar graph
chart
line graph
pie graph

Answers: 2


Other questions on the subject: Biology
Biology, 22.06.2019 05:00, mydoggy152
Penelope studies how the structure and function of the nervous system is related to behavior. she is a psychologist
Answers: 1
Biology, 22.06.2019 06:00, caleelwittmann31
Guinea pig coat color is determined by a single gene. the allele for black coat color is dominant to brown. in a cross between twoblack-haired guinea pigs, 20 offspring are born. if both parents were heterozygous, probability would predict that approximately howmany of the 20 offspring would have brown hair?
Answers: 1
You know the right answer?
Gerald performed an experiment to determine if photosynthesis was affected by the amount of light th...
Questions in other subjects:

Mathematics, 02.12.2021 22:50

English, 02.12.2021 22:50
English, 02.12.2021 22:50
Biology, 02.12.2021 22:50

Mathematics, 02.12.2021 22:50


