
Biology, 24.06.2019 07:30 bannedccnt
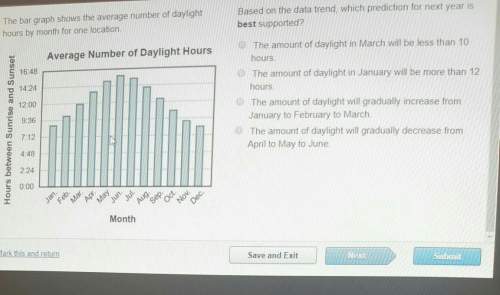
The bar graph shows the average number of daylight hours by month for one location. based on the data trend, which prediction for next year is best supported?

Answers: 1


Other questions on the subject: Biology
Biology, 22.06.2019 12:20, Yumimiku6539
Which organ controls breathing? lungs alveoli heart diaphragm
Answers: 2
Biology, 22.06.2019 18:00, Pranav2004
Select the correct answer. for their summer holiday, jane and her family are visiting places surrounding the mediterranean sea. which type of biome is jane and her family visiting? a. rainforest b. shrubland c. tundra d. coniferous forest reset next
Answers: 1
Biology, 22.06.2019 23:30, mathman783
Rna primer constructed during dna replication needs to be replaced because rna differs from dna. it contains ( adenine, cytosine, uracil ) instead of ( adenine, guanine, thymine ).
Answers: 3
You know the right answer?
The bar graph shows the average number of daylight hours by month for one location. based on the dat...
Questions in other subjects:

Mathematics, 23.04.2020 05:34

English, 23.04.2020 05:35


Social Studies, 23.04.2020 05:35


