
Arts, 03.01.2022 14:00 Jalenmiller492
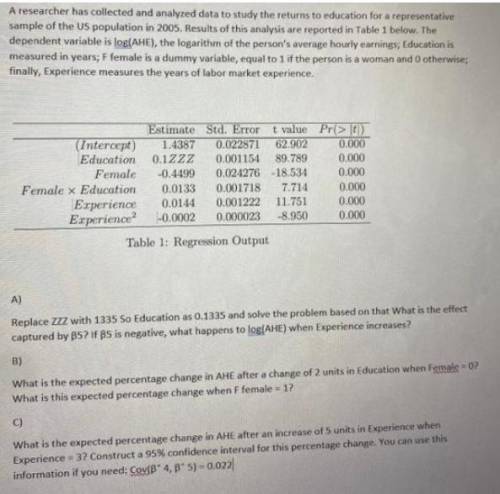
A researcher has collected and analyzed data to study the returns to education for a representative sample of the US population in 2005. Results of this analysis are reported in Table 1 below. The dependent variable is log[AHE), the logarithm of the person's average hourly earnines; Education is measured in years; Ffemale is a dummy variable, equal to 1 if the person is a woman and otherwise; finally, Experience measures the years of labor market experience. Estimate Std. Errort value Pr(> l) (Intercept) 1.4387 0.022871 62.902 0.000 Education 0.1ZZZ 0.001154 89.789 0.000 Female -0.4499 0.024276 -18.534 0.000 Female x Education 0.0133 0.001718 7.714 0.000 Experience 0.0144 0.001222 11.751 0.000 Experience? -0.0002 000023 -8.950 0.000 Table 1: Regression Output A) Replace ZZZ with 1335 So Education as 0.1335 and solve the problem based on that What is the effect captured by B52 if ß5 is negative, what happens to log AHE) when Experience increases?
B) What is the expected percentage change in AHE after a change of 2 units in Education when Female =0? What is this expected percentage change when F female = 12
C) What is the expected percentage change in AHE after an increase of 5 units in Experience when Experience = 3? Construct a 95% confidence interval for this percentage change. You can use this information if you need: CVIB* 4,B5) = 0.022

Answers: 1


Other questions on the subject: Arts
Arts, 23.06.2019 07:30, denisturcios18
1. according to bertrand, what is the purpose of relaying the story of samson at the beginning of the chapter? in other words, what does it have to do with the subject matter?
Answers: 3
Arts, 24.06.2019 23:30, BIGJAYWESTSIDE
What were some of the characteristics of renaissance art?
Answers: 1
You know the right answer?
A researcher has collected and analyzed data to study the returns to education for a representative...
Questions in other subjects:

History, 25.07.2019 13:30

History, 25.07.2019 13:40

Physics, 25.07.2019 13:40

History, 25.07.2019 13:40

Mathematics, 25.07.2019 13:40
Mathematics, 25.07.2019 13:40


