
Advanced Placement (AP), 18.03.2021 20:00 calebnlocke
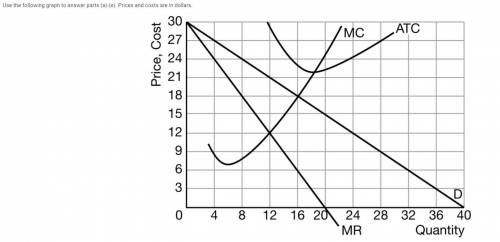
The graph above shows the demand (D), marginal revenue (MR), marginal cost (MC), and average total cost (ATC) curves for one of many profit-maximizing firms operating in the short run in an industry in which there are no barriers to entry. Each firm sells a similar but not identical product.
(a) What will happen to total revenue if the firm raises the price from $9 to $12? Explain.
(b) At 16 units, is the firm producing at the allocatively efficient quantity? Explain.
(c) If the firm produces 12 units, will the firm’s economic profit be positive, negative, or zero? Explain.
(d) Use the relationship between the marginal cost curve and the average total cost curve to explain why the average total cost curve is increasing at 20 units.
(e) Calculate the consumer surplus if the firm charges the profit-maximizing price. Show your work.

Answers: 1


Other questions on the subject: Advanced Placement (AP)
Advanced Placement (AP), 23.06.2019 08:20, ksanchez2100
Free 20 points + brainliest to whoever answers right! in the event of a crash, personal injury protection (pip) coverage pays toward the medical costs for a. any injuries you cause to others b. any injuries that are not your fault c. your injuries if you are not at fault d. your injuries, regardless of who's at fault
Answers: 2
Advanced Placement (AP), 23.06.2019 12:50, gonzalesnik
Want free points + free brainliest? answer this drivers ed question correctly and i got you! a higher grade number for oil means it is a. heavier b. more viscous c. less viscous d. more important
Answers: 2
You know the right answer?
The graph above shows the demand (D), marginal revenue (MR), marginal cost (MC), and average total c...
Questions in other subjects:


Arts, 16.10.2020 07:01

Mathematics, 16.10.2020 07:01


English, 16.10.2020 07:01


