Analyze the graph below and answer the question that follows.
The graph above shows the...

Advanced Placement (AP), 27.02.2020 00:09 pls391
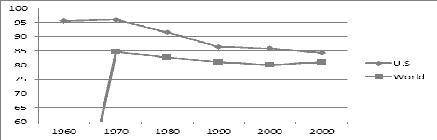
Analyze the graph below and answer the question that follows.
The graph above shows the consumption of fossil fuels around the world and in the US since 1960. US consumption decreased from 1970 to 2009, while the world average consumption remained approximately even from 1970 to 2009.
Why did US consumption decrease?
A)
The US population dropped between 1970 and 2009.
B)
The US population became aware of the fossil-fuel dependency and have reduced their consumption.
C)
The US is running out of fossil fuels, and fossil fuels are too expensive to purchase from foreign sources.
D)
none of the above

Answers: 3


Other questions on the subject: Advanced Placement (AP)
Advanced Placement (AP), 23.06.2019 14:00, marenh04938
Which of these is the most likely way long-term economic growth takes place? a) increases in interest rates b) increases in overall price level c) increases in labor productivity growth d) increases in labor force participation rate
Answers: 1
Advanced Placement (AP), 25.06.2019 17:30, valencial0917
Identify one similarity between china and europe that explains their decisions on wether to explore or conquer lands around the indian ocean
Answers: 1
Advanced Placement (AP), 26.06.2019 09:30, KariSupreme
Compare and contrast between mitigation and adaptation responses to climate change. this is for my environmental science class. i need 200 words by tonight.
Answers: 3
Advanced Placement (AP), 26.06.2019 09:40, roshawnandries5471
Which of the following would most likely be a preservationist, as opposed to a conservationist, approach to public land management? i. allowing unrestricted boat access to a lake ii. allowing atv use in all areas of public land iii. closing fragile sections of a park to tourists i only ii only iii only i and iii ii and iii
Answers: 1
You know the right answer?
Questions in other subjects:

Biology, 01.12.2021 22:40

Mathematics, 01.12.2021 22:40

Physics, 01.12.2021 22:40
Mathematics, 01.12.2021 22:40
Biology, 01.12.2021 22:40
Mathematics, 01.12.2021 22:40


